Nylon Calculus: A deeper look at turnovers

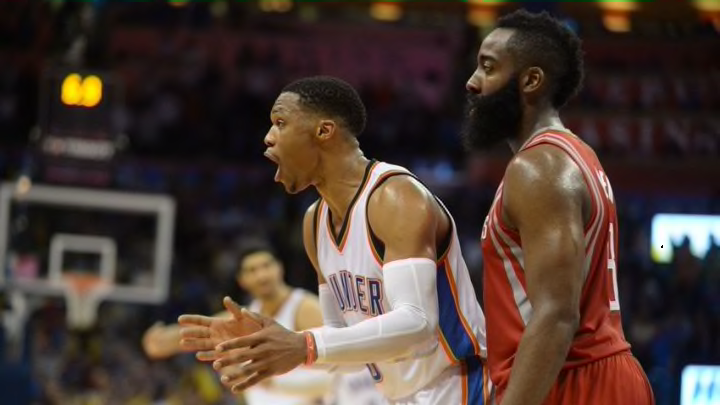
Both James Harden and Russell Westbrook are on pace to finish with the most turnovers per game since the NBA started tracking turnovers. Those are eye-popping numbers but calling Harden or Westbrook the most turnover-prone players in history isn’t really a fair way to evaluate either player since both of them are heavily involved in their team’s offense, to a historic degree.
We can check their turnover percentages, but the nature of that statistic is also somewhat skewed by their extreme usage. A more appropriate stat would be to look at their turnovers per touch.
Both Westbrook and Harden remain in the top-15 in the league but they are no longer lapping the field. However, even turnovers per touch can be deceiving because it treats all turnovers equally and we know that isn’t the case. Both Seth Partnow and Mike Beuoy have found a massive difference in points per possession and effective field goal percentage on a possession following a steal (a live ball turnover) versus a dead ball turnover.
A more accurate assessment of the costs of Westbrook and Harden’s turnovers would be to separate out the live ball turnovers from the dead ball ones.
Interestingly, Westbrook seems to have a higher proportion of costly turnovers than Harden and we can see him move ahead of Harden (or behind depending on your point of view) in live ball turnovers per 100 Touches. We also see a lot more point guards and a lot fewer centers in the top-20. We can see this effect by looking at a box plot of live ball turnovers by position.
The average live ball turnover per touch follows an ascending order across the positions (with the exception of power forward and center where both positions are roughly the same in average live ball turnovers per touch). The reason for this is that bigs tend to have more offensive fouls, traveling and other dead ball type turnovers.
We can also look at turnovers per minute of possession and we see that point guards are less likely to turn the ball over for every minute that they possess the ball. This makes intuitive sense as guards tend to hold the ball more (for each touch) versus a big who typically does not possess the ball very long on each touch. Likewise, guards and wings typically have better hands and are less prone to turning the ball over for the time they are in possession of the ball.
We can also break down turnovers by type (i.e. lost ball, bad pass, etc.). We can scale these to “per touch” numbers as well.
When we look at the lost ball turnovers, we see mostly centers leading the way. Miles Plumlee has quite the lead on the rest of his competition which unfortunately for him is quite common no matter which turnover metric you look at. Joel Embiid, a rookie who leads all centers in touches per 36 minutes, is second. That should be a shock to no one. Meanwhile, Harden isn’t leading point guards in lost ball turnovers per 100 touches but he is among the leaders. Westbrook is a bit lower behind John Wall.
For bad pass turnovers, we see mostly guards and wings among the leaders. The first center, is you guessed it, Miles Plumlee. Harden and Westbrook come in second and third behind Jeremy Lin in bad pass turnovers per touch. So it appears both of them are mostly turning the ball over when attempting to make passes. Interestingly, if we look at live ball, bad pass turnovers per touch, we see Westbrook has more than Harden. This matches what we saw earlier where Westbrook had more live ball turnovers per touch than Harden.
When looking at these turnover numbers, we get a better idea of how players take care of the ball given their role in the offense. And we can also parse out the more disastrous turnovers — live ball turnovers — to determine which players are costing their team more points on the defensive end by giving their opponents more transition opportunities. As we see with both Westbrook and Harden, sometimes the player who is turning the ball over more isn’t necessarily having the more costly turnovers.
All statistics in this post were updated through games played on January 11th, 2017.