The NBA’s Inequality Problem: Defense Earns 60 Cents on the Dollar

Mathematically speaking, success in the NBA at an organizational level can roughly be thought of as a function of two factors– how much money you spend, and how efficiently that money is spent. The ‘how much’ part mainly comes from how much you are willing to spend and what cap tricks/planning you’re able to do, and the ‘how efficient’ is about how much each dollar you spend helps or hinders your teams chances of winning a title (with the caveat of time horizons, you may not try to be winning immediately, but trying to maximize those probabilities for a later date).
Teams are constantly trying to find market inefficiencies and advantages compared to others in a sport that is evolving, and the league as a whole is getting smarter all the time. Analytics have been a big part of that evolution, especially when it comes to understanding efficiency and shot selection. On the defensive end however, you could argue that the numbers haven’t been able to make a huge dent in how defensive value is understood, even if there are fairly good methods of doing so today.
Offense is easier to understand– everyone can see how awesome a Jamal Crawford crossover is, but it’s much harder to understand and appreciate little things players like Andre Iguodala do on defense that are just as, and more, impactful to the result of a game. It’s just much more difficult to and evaluate good defense.
When thinking about what the NBA might not be doing at an optimal level, I hypothesized that rewarding and valuing defense are things that teams are doing poorly and that it could be one of the biggest market inefficiencies in the league (something Daryl Morey referenced on the Grantland Basketball Hour during the playoffs). And with adjusted plus-minus systems that estimate a players impact on the court in points per X possessions, those inefficiencies could be studied with how they relate to player salaries.
Below are two graphs that show what I found, when examining the relationship between salary and player performance.
The first chart features linear models, the second exponential ones. The exponential ones are more accurate, especially at the high end of the spectrum (after around +5 points). In each graph, the x-axis represents a player’s Real Plus-Minus. The y-axis is the ‘expected player salary’ given a certain plus minus score (impact in points per 100 possessions). The green line shows the relationship between defensive performance and salary. Red is offense and orange is combined (actual RPM). The overall numbers are a bit suppressed because of rookie salary numbers.
If you’re a player who’s better than the average NBA player by one point per 100 possessions, and that value comes on offense, you’re likely to earn around 20 percent more than your defensive counterpart. And the very elites, around +4 points on offense or defense have a 40 percent difference in expected earnings. The defensive equivalent of a $11 million offensive player, is only expected to make $7 million.
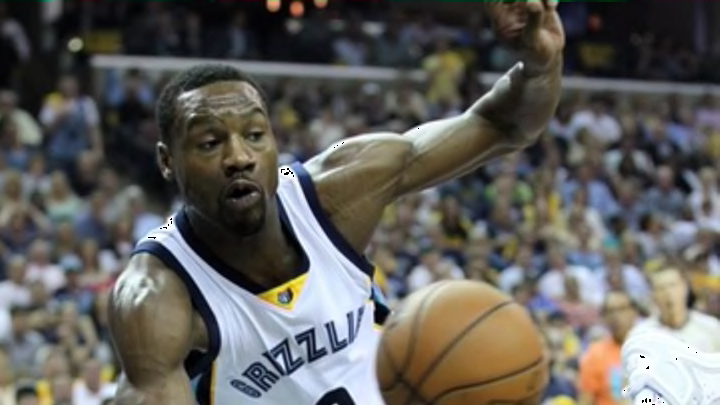
Tony Allen is one of the biggest sufferers of the discrepancy between offensive and defensive players– Allen had an average 3.84 DRPM over the last two season, which should have earned him an approximate $8 million dollar salary even with his minus offense. Allen’s counterparts who had an offensive impact comparable to his defensive impact had an expected salary of around $10 million, which is more than double Allen’s salary.
Even this season, Carmelo Anthony just by his offense alone could have commanded a $18 million salary, but ranked as one of the worst defenders in the league, which should have take away a third of his value. And the same ratio, albeit with a smaller salary, goes for Rudy Gay. Assuming even relative accuracy of these models, if not case-by-case but as a whole, these numbers should massively weigh on contract decisions. 20-40 percent inefficiencies in market value is beyond excessive.
You don’t have to be a fan of adjusted plus minus systems to see that there is a massive discrepancy in how defense is rewarded in salary. And there are definitely opportunities to be had by finding defensive gems either through free agency or the draft.