Nylon Calculus: Did lottery reform actually curb tanking?

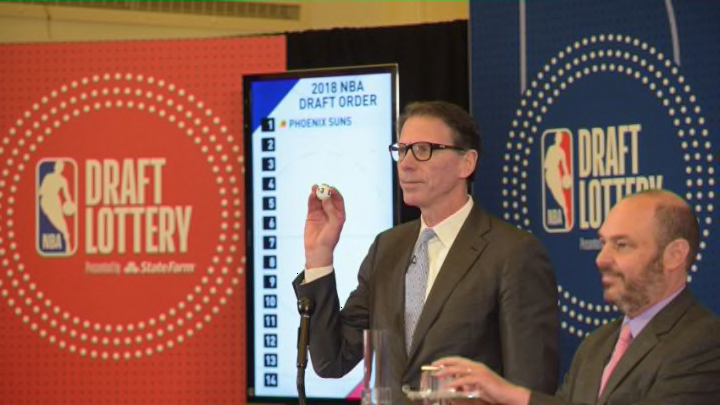
The NBA draft lottery is going to be a bit different this year. Unlike basement dwellers from years past, the New York Knicks will NOT be swimming in ping-pong balls on Tuesday night. In fact, the Knicks will have 110 fewer winning combinations than the Phoenix Suns did last year — leaving them only about half as many chances to land the top pick.
Prior to the 2017-18 season, the Board of Governors voted to flatten the 2019 lottery odds, giving the team with the league’s worst record a little less help than before. The change was deemed “necessary to improve the competitive incentives” for the teams; that is, the reform was meant to deter tanking. But did it work? Were the new draft lottery odds actually successful in discouraging the practice of tanking?
To quantify whether this season’s teams tanked any less than last season’s, I’m going to borrow an approach from my fellow Nylon Calculus contributor, Michael Chang. His idea was to chart changes in team ages over the course of the season and to take any signs of end-of-season decreases in age as evidence of tanking.
I started with the age of each player on the first game of the 2017-18 and 2018-19 seasons. For each individual game, I calculated each team’s average age weighted by minutes played. Then, for each team, I found the difference between the average age in each game and the average age for the whole season and charted these differences. Just to smooth the lines out a bit, I plotted 10-game rolling averages.
Among those destined for the lottery, there were more teams in 2018-19 who stayed the same age or got older at the end of the year (N=6) than there had been in 2017-18 (N=3). Correspondingly, more lottery teams got younger at the end of the season in 2017-18 (N=11) than did this year (N=8).
The number of lines found in each panel tells us part of the story, but the colors of the lines are important here, too. The color scheme is tied to a team’s win-loss record (i.e. the number of games above 0.500) with darker blue lines indicating more dire situations. Last year, the pattern was predictable — teams with mediocre win-loss records (gray or light blue lines) maintained a consistent cohort of players (a flat line) for most of the year and reduced the average age (a declining line) at the very end, only after it became clear that the playoffs were out of reach. Teams with worse records (darker blue lines) turned to younger players earlier in the year, soon after the All-Star Break. In contrast, this year, some of the darkest blue lines stayed relatively flat all season long.
Using these charts we can also assign a simple tank rating to both of the two most recent seasons. For each team, we can count up the consecutive number of games during which the players were younger than the team’s average age to close out the season. Then, sum up all of the below-average age, end-of-season streaks across all the lottery teams to find the tank rating. In 2017-18, the lottery teams finished up with 148 younger-than-usual games. In 2018-19 that sum was reduced to 107, suggesting that there were perhaps 41 fewer tanking-influenced games this year — or about 3 less per lottery team.
If you are interested in finding the age trends for a particular team you can find the annotated and interactive chart below. Filter by team, season, rank, or record: