Round 2 Preview: San Antonio Spurs vs. Oklahoma City Thunder
By Justin

Here at Nylon Calculus we track and analyze a wide variety of stats, so here are a few hand-picked ones offered as preview of the Spurs-Thunder series.
HBox Leaders:
San Antonio’s leader is obvious: Kawhi Leonard leads the team with an HBox of 5.4 points per 100 possessions, although Tim Duncan isn’t far behind at roughly 3 points. Given the questions about his shooting coming into the league, it’s commendable Leonard has become such a good shooter – third in the league in “points over average”, an efficiency measure which combines volume and efficiency compared league average. Russell Westbrook and Kevin Durant were, respectively, second and third in the league in HBox. Few duos in NBA history compare to the level of destruction they wreak. Kevin Durant has the efficiency — he was just ahead of Leonard in that respect but a mile behind leader Stephen Curry, of course — while Westbrook has just about everything else in the box score. Given those broad contributions, any box score-based measure like HBox could overrate Russ, particularly on the defensive end where he’s more of a gambler than a stopper. But he is undeniably an important facet of Oklahoma City’s power.
True usage:
True usage is a measure of a player’s involvement in terms of both shooting and making plays, and it’s a great way to compare the two teams and how they differ. Russell Westbrook leads the league in true usage, as he’s a high volume shooter with a number of assists and turnovers, while Kevin Durant has a higher true usage than any Spurs player. San Antonio’s approach is more egalitarian. Seen in the below charts, they have a greater balance in their true usage numbers.
Rim protection:
Lord Tim Duncan is a senior rim protection master, but his numbers aren’t truly elite. Opponents shoot 47.1% when he’s near the rim, and he does have trouble tracking speedy players. Consequently, he may have issues guarding the Thunder. Serge Ibaka, meanwhile, has an opponent percentage of 43.3%, one of the best in the league, and while he “contests” fewer shots near the rim than Duncan, he’s a power forward and is not expected to be near the rim as frequently defensively. However, Ibaka has surprisingly poor rim deterrence numbers -opponents have more field goals attempts at the rim when he’s on the court[1. The same was true in 2015.] and preventing a shot taken near the rim is more valuable than contesting one.
Jumping to Conclusions:
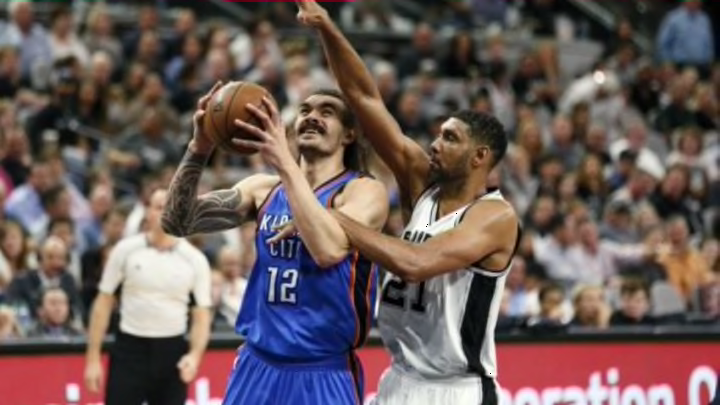
This is a battle of experience versus prowess. No one has been involved in more jump balls than Tim Duncan since the stat has been trackable (1997) yet his opening tip jump ball win percentage is a modest 59.9%. However, Steven Adams’ win percentage is 73.1% — with a minimum of 100 opening tip jump balls, no one has a higher win percentage. Even after adjustments Adams still has a sizable advantage. Using my own estimates, the probability of Adams winning the tip is 59%. This is obviously the most important match-up of the series, and it’s one where Oklahoma City could have a distinct advantage.
Prediction:
Based on the numbers, the Spurs are the likely victors with a probability of 75.4%. The numbers used here and seen below are a mix of team ratings with a few players factored in and projected RPM via Nathan Walker. The team rating method is also explained here, and it’s essentially what you see at basketball-reference with SRS but it’s using a more robust method, ridge regression, with a few key players as additional variables, including Kevin Durant and Kawhi Leonard. The Spurs, even when accounting for Kevin Durant’s missed games, are simply sensational. Thus, with homecourt advantage, they’re the favorites purely by the numbers. The question is, will the Spurs have problems with the Thunder as they’ve had in previous post-seasons? Match-ups are an inexact science, but the Spurs are probably good enough to overcome that weakness this season.