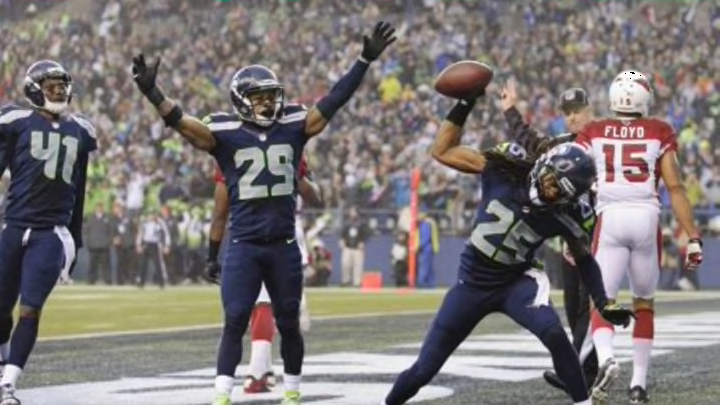
“The team that wins the turnover battle wins the game.”
Those words, or at least ones very similar, have been preached by football coaches and analysts for as long as the NFL has been playing games. So if I told you that teams in today’s NFL that consistently won the turnover battle won almost twice as many games as those that consistently lose the turnover battle, I’m guessing you wouldn’t be very surprised.
In order to make sure that this long held belief was just as true today as it was generations ago I decided to check the numbers for myself. I actually first looked into the turnover differential numbers for a piece I wrote for Fansided’s Chiefs blog, Arrowhead Addict. If there are any Chiefs fans that would like to check it out, you can read it HERE. That post got me looking into the turnover differential numbers for the past five seasons (2009-2013). What I found is that the numbers do link turnover differential and winning percentage.
During that five-year span teams that finished in the top ten in turnover differential finished 521-278-1. That’s a winning percentage of 65.2 percent and equates to about 10.4 wins per season. On the other end of the spectrum, the teams that finished in the bottom ten in turnover differential finished 287-512-1. That’s a winning percentage of about 35.9 percet and equates to about 5.7 wins per season.
The connection between turnovers and wins is indisputable. One could have a “chicken or the egg” debate over the relationship between the two. Do teams lose because they turn the ball over or do teams that are losing turn the ball over more because they have to gamble because they are losing? The answer probably lies somewhere between the two. Turnovers are like quicksand. A team commits a turnover that causes them to fall behind, they press because they’re in a hole and commit another, then they’re far enough behind that they have to gamble and they just continue to sink deeper and deeper.
With the good teams it’s the exact opposite. They don’t turn the ball over. They put the pressure on the opposing team and when that team makes a mistake they capitalize. As their lead grows they can play it safe and sit back and wait for the opposition to make another mistake. When it comes to turnovers the rich get richer and the poor get poorer.
So the question then becomes how can a team become one of the “rich” when it comes to turnover differential? As I looked through the numbers for the past five seasons I found that there were multiple examples where teams had dramatic shifts in turnover differential (both good and bad) that correlated with drastic changes in their win/loss record. The following slides will look at those teams to see if there are similarities in what caused these dramatic changes in production.
