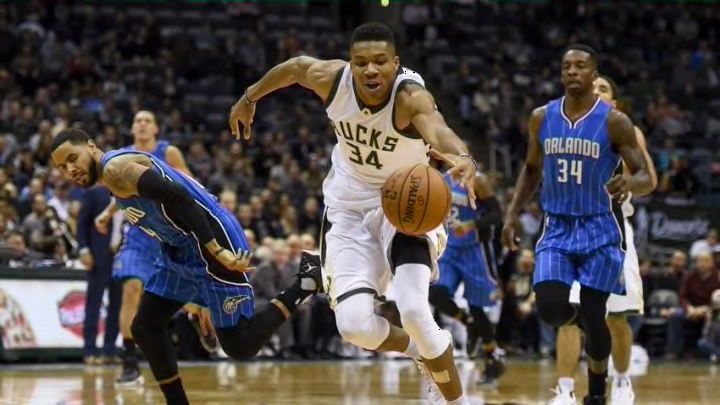
One of the best additions to stats.nba.com has been the tracking of hustle stats. These stats first appeared publicly during last year’s playoffs and while it’s too early in the season to determine the significance and predictive ability of these stats, we can take an early look at the leaders while keeping in mind that we’re dealing with a small sample size. Earlier, Andrew Johnson took a look at deflections. Here, we’ll look at the loose balls recovered stat.
Ideally, we’d like to develop some type of ratio statistic that measures a players’ success rate at recovering loose balls. Unfortunately, there’s no “failed to recover loose balls” stat. However, using some of the details available in the play-by-play data, we can come up with an approximation.
We can start out with loose ball fouls, which are an attempt to recover a loose ball that fails and ends in a foul. We can also use lost ball turnovers since a player that loses the ball should be trying to recover it. We can remove sequences where a lost ball turnover is followed by a loose ball foul are removed so that we aren’t double counting but there are only 11 of those sequences this year. (Here’s a list.)
Read More: Measuring defense with shot-blocking efficiency
However, since we only care about loose balls that can be recovered, we want to use lost ball turnovers that are also steals. Now there is an argument to be made that deadball lost ball turnovers should also be included because the player (and the opposing team) is trying to recover it. However, if we include it, we’re not measuring a success for anyone, i.e. if a player turns the ball over and it goes out of bounds, the defense isn’t recovering a loose ball whereas with a steal or any other loose ball recovered, someone is recovering it.
Finally, one other statistic worth including is steals coming off lost ball turnovers. This won’t be in our “ratio” statistic because the steal should actually be credited to the player who causes the steal as opposed to the player who recovers the loose ball (and so not surprisingly, steals coming off lost ball turnovers have a higher correlation with deflections than it does with loose balls recovered, which is why having the loose balls recovered stat is a nice addition). Unfortunately, there is some error in this within the play-by-play. Sometimes the player who recovers the loose ball is credited with the steal but from my experience, this is rare and shouldn’t throw off our approximation too much.
So how do we calculate our success rate from earlier? I’ve come up with two different methods and I’m not really sure which is better so I’m displaying them both. Unfortunately, we can’t really perform any tests to see which is better because we’re too early in the season.
The first: Loose Balls recovered / (loose ball fouls + lost ball turnovers off steals + 1). This is a ratio of successes to (approximate) failures. The plus 1 is included so we don’t have any zeroes in our denominator.
The second: Loose Balls recovered / (loose ball fouls + lost ball turnovers off steals + loose balls recovered). This is more along the lines of a success rate.
The leaders for this year:
A few observations from this first pass: Richard Jefferson has the highest ratio and along with Kyle Anderson, they are the only players with a 100 percent success rate (minimum 200 mins played).
For the most part, a lot of players with the best ratios/success rates are good defensive players.
Many bigs are among the players with the lowest ratios/success rates while many guards and wings are among the best players.
James Harden is among the lowest in terms of both ratio and success rate. His league leading number of live lost ball turnovers (fourth on a per 36 minute basis) seems to be the issue. Steph Curry is fourth in loose balls recovered per 36 mins which combined with his low loose ball foul ratio (just 1 loose ball foul in 604 minutes) is why he’s among the leaders in both ratio and success rate.
Both Celtics guards Marcus Smart and Avery Bradley are among the best in both ratio and success rate.
We will continue playing with these numbers throughout the season, so check back in for more.
