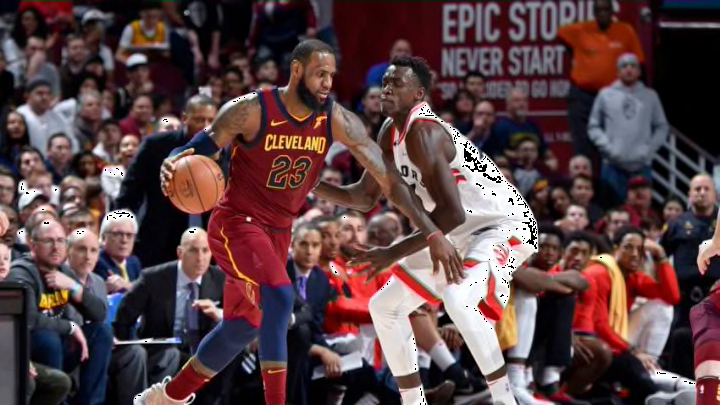
While many people are leaning Cleveland this series simply because of LeBron James, there’s a good reason the stats are favoring Toronto — the respective benches, or, honestly, everyone outside of James.
If you look at a projected rating by only using BPM, games started, and weigh by minutes played, Toronto clocks in at +8.6 while Cleveland comes in right behind at +7.1. Once you factor in James’ super-human ability to crank up the minutes and effort, you can see how the Cavaliers can match most elite teams.
But once the starters leave the court things get different. Toronto’s non-starters’ rating weighed by minutes played in the regular season? +6.3. Cleveland’s? -7.5. Yes. Toronto’s bench nearly has the power of Cleveland’s starters. Bench rating isn’t quite as useful in the playoffs as it is in the regular season, for obvious reasons. This is why metrics that rely on those regular season stats see Toronto as the large favorite. But Cleveland can play James 40+ minutes a night, and the midseason trades reshaped the rotation with Larry Nance Jr., a positive force, coming off the bench. It’ll be interesting to see how these two compare when matched-up. Just realize that once the starters have to rest, the Raptors may go in for the kill.
— Justin Willard (@AcrossTheCourt)
Defensive matchups
As with most playoff series that involve the King, this one will likely come down to whether Toronto can find some way to contain LeBron James.
The regular-season games were inauspicious for the Raptors. LeBron torched them for 29 points, 7 rebound and 8 assists per game on 68 percent true shooting and 30 percent usage. He orchestrated some amazing offensive attacks against them. While the Raptors handed the Cavs their worst loss of the year in their first head-to-head matchup, Cleveland returned the favor with a 125 offensive rating in the ensuing two games. This included the Cavs’ best offensive and the Raptors’ worst defensive performances of the campaign — 137 points per 100 possessions on March 21.
The following animated chart shows how Toronto matched up defensively against Cleveland in each of their three regular-season games. Each line indicates the defender who spent the most time guarding a specific offensive player on a given possession. The thicker the line, the more frequent the matchup.

Rookie OG Anunoby has spent the most time on LeBron, serving as the primary defender on 106 possessions, or roughly 49 percent frequency. Pascal Siakam has come in second, with much of his matchup taking place during the March 21 game. Toronto is likely to continue this arrangement, but head coach Dwane Casey must be prepared with adjustments, since Anunoby and Siakam are bound to have their hands full.
— Positive Residual (@presidual)
Offensive styles
These charts are not meant to evaluate whether an offense is good or bad. They are designed to help illustrate how teams go about the goal of trying to put the ball in the basket. Each team’s offense is evaluated on four stylistic spectrums.
Ball movement is measured with the average touch time for each team, from the NBA’s player tracking statistics. A lower average touch time means the ball is moving from player to player more quickly.
Player movement is measured with a combination different NBA.com tracking statistics, and works out to average distance traveled per 24 seconds of offensive possession.
Pace is measured with the average length of an offensive possession from Inpredictable, a more accurate representation for how quickly a team is working than traditional pace.
Shot selection is measured with MoreyBall percentage — in this case the percentage of a team’s true shooting opportunities that came at the rim, from the free throw line, or on a 3-pointer. It’s a generalized measure but captures something about how much each team hews to the shots that are, on average, the most efficient.
On the graph below you’ll see a line for each team’s offense. As the line moves away from the center of the graph on each axis you’re seeing more of that stylistic trait. For example, shot selection shows a (hypothetically) more efficient shot selection the further you are from center. Here’s how the Raptors and Cavaliers match up.

These are two of the better offenses in the league and Cleveland and Toronto are almost identical with regards to shot selection and pace. The difference is that the Cavaliers still relay on LeBron James as the primary fulcrum to create open shots, where the Raptors have moved towards egalitarian movement instead of relying so heavily on DeMar DeRozan and Kyle Lowry. It will be interesting if the Raptors evolution can hold up now that it’s matched up against such a familiar foe.
— Ian Levy (@HickoryHigh)
Win probabilities
To project the series, I am using my in-season game projection model. The model is trained off historical game data, and accounts for rest, travel, team strength, and matchup. Since I began using the model to predict outcomes, I have been able to correctly identify the winner in about 70 percent of games.

The Cavaliers survived a tough seven-game series against the Pacers, and have an even tougher series against the Raptors in front of them now. My model has the Raptors nearly as likely to sweep the series (11.2 percent) as any single outcome which the Cavaliers win (11.4 percent for the Cavs to win in six). The Pacers showed how easy it was to get quality shots off against the Cavaliers defense, and the Raptors are even better situated to take advantage of those defensive errors. The Raptors should be considered decent favorites to move on, so long as they do not let LeBron get into their heads as they have in previous seasons.
— Jacob Goldstein (@JacobEGoldstein)
