The Whiteboard is The Step Back’s daily basketball newsletter, covering the NBA, WNBA and more. Subscribe here to get it delivered to you via email each morning.
Every team has the same goal on offense — score as many points as possible. But every team goes about that in a different way, using different patterns of movement, different rhythms of passing and shot distribution.
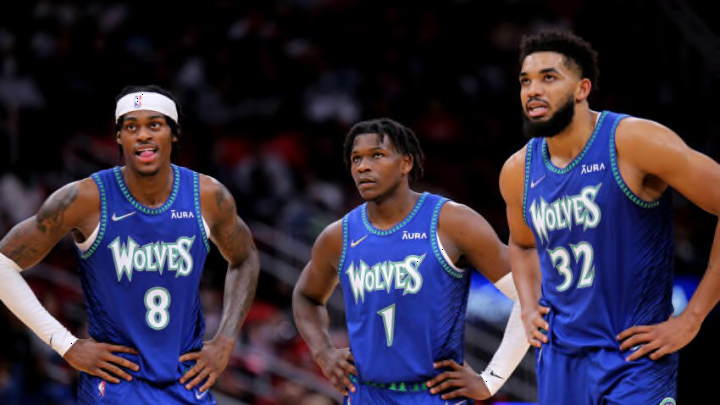
We find examples of these differences every year among the best and worst offenses in the league. The Nuggets and Timberwolves were tied for the sixth-most efficient offense in the league this season, at an identical 113.8 points per 100 possessions. But the ways in which they went about creating that efficiency couldn’t have been more different.
For the past few seasons, we’ve used offensive style charts as a way of visualizing those different approaches and it’s time to look back on what each team did this season. These charts are not meant to evaluate whether an offense is good or bad. They are designed to help illustrate how teams go about the goal of trying to put the ball in the basket. Each team’s offense is evaluated on four stylistic spectrums.
Ball movement is measured with the average touch time for each team, from the NBA’s player tracking statistics. A lower average touch time means the ball is moving from player to player more quickly.
Player movement is measured with a combination of different NBA.com tracking statistics and works out to average distance traveled per 24 seconds of offensive possession.
Pace is measured with the average length of an offensive possession from Inpredictable, a more accurate representation of how quickly a team is working than traditional pace.
Shot selection is measured with MoreyBall percentage — in this case the percentage of a team’s true shooting opportunities that came at the rim, from the free-throw line, or on a 3-pointer. It’s a generalized measure but captures something about how much each team hews to the shots that are, on average, the most efficient.
On the graphs below you’ll see a line for each team’s offense. As the line moves away from the center of the graph on each axis you’re seeing more of that stylistic trait. For example, shot selection shows a (hypothetically) more efficient shot selection the further you are from the center.
I’ve identified several different groupings of similar offensive styles and we’re going to spread out and look at them each over the next few installments of the newsletter. To start with, here is the most common grouping, a style that six different teams appeared to ascribe to this season.
NBA offensive style: A lot of everything


This grouping is teams that rank very highly in all four stylistic traits. In years past I have used a 50th percentile rank in all four categories as the cut-off; the Pistons just missed that, ranking in the 46th percentile in pace. However, they were much more similar, stylistically, to these teams than any other grouping so I’ve included them here.
These teams are all heavily focused on a specific shot profile — shots at the rim and from beyond the arc and they utilize plenty of movement, both of players and the ball to get there. For many, fans this is an idealized form of offensive efficiency. But this group is also a great example that it takes both style and talent to create efficiency. The offensive rating of these six teams runs the gamut from the Timberwolves at No. 7 to the Thunder, dead last this season.
In most cases here, we’re looking at strategic sources that have persisted across multiple seasons. Five of these six teams were in the same offensive style category last season and that even includes two teams (Timberwolves and Pacers) who changed coaches coming into this season. The exception is the Detroit Pistons, whose offense looked very different last year.

The two biggest changes for the Pistons’ offense were in pace (17th percentile to the 46th percentile) and ball movement (23rd percentile to the 72nd percentile). The second number seems particularly relevant considering Detroit was integrating a ball-dominant creator in rookie Cade Cunningham. But even with Cunningham taking the reins of the offense in an impressive rookie season, the Pistons still finished fourth in the league in passes per game (averaging nearly 20 more passes per game than they did last year) and cutting their average touch time significantly.
It may be that Cunningham’s individual talents lead them towards a more heliocentric system like the ones the Mavericks run with Luka Doncic or the Hawks run with Trae Young. But with so much of their rebuilding roster unfinished it’s nice to see the Pistons experimenting and trying some different things, rather than boxing themselves into the kind of single-creator system that can be difficult to unspool later.
Tomorrow we’ll take a look at two more groupings, with style charts for the Cavaliers, Lakers, Rockets, Knicks, Jazz and Trail Blazers. Make sure to subscribe to The Whiteboard so you don’t miss a thing.
Other NBA stories:
The NBA’s regular season has come and gone, but an important question remains: What are the top 10 power dunks of the 2021-22 season?
The Timberwolves and Warriors are both at their best when their offenses are balanced. The Timberwolves lost Game 2 but it’s one of the reasons they have a chance against the Grizzlies, and it’s why the Warriors look absolutely dominant against the Nuggets.
Everyone is talking about Rudy Gobert’s defense. Now Rudy is talking about it too.
It’s hard to separate Pascal Siakam from the conversation about him. But if you can manage it (Rob Mahoney can), what you find is miraculous.
