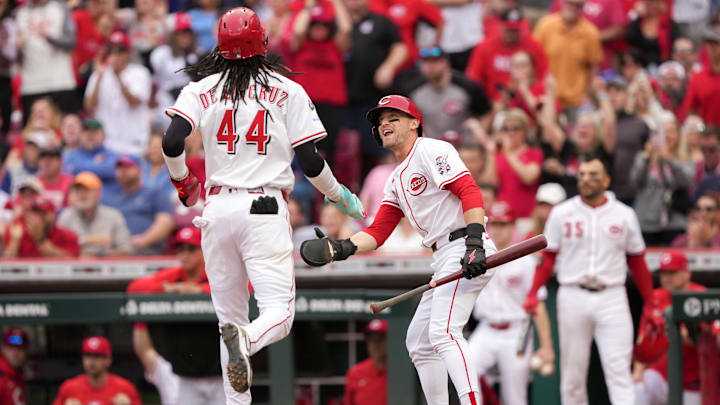
We are now just past the one-third mark of the MLB 2025 season, and with that, we have a decent sample size for what most players have done this year. In today's game of baseball, however, we have the pleasure of diving into advanced analytics — and a lot of times, your typical surface-level numbers don't tell the full story. In this piece, we'll discuss two hitters who have been the beneficiary of good luck, and could see their numbers slide as the season continues.
For more news and rumors, check out MLB Insider Robert Murray’s work on The Baseball Insiders podcast, subscribe to The Moonshot, our weekly MLB newsletter, and join the discord to get the inside scoop during the MLB season.
Are TJ Friedl's numbers due for a set back?
Through the first third of the season, Cincinnati Reds center fielder TJ Friedl has enjoyed a strong start, but his under-the-hood metrics suggest decline is on the way. After Friday's matinee vs. the Chicago Cubs, Friedl is now hitting .306/.390/.431. The on-base percentage is still commendable even with a lower batting average, but that batting average draws questions. Going into Friday's contest:
BA: .301
xBA: .257
BABIP: .353 (league-average typically around .300)
SLG: .413
xSLG: .327
Two of Friedl's main stats in his slash line, batting average and slugging, signal that a clear drop off may be imminent. His higher than average BABIP, or batting average on balls put in play, also suggests regression may be coming, as non-superstar players will typically regress closer back to the league average of .300 as time goes on.
Friedl's below-average hard-hit rate of 31% is why his expected slugging percentage is drastically lower than his actual slug. With slugging, it's hard to take much away from what a player has accomplished, but the metrics don't expect it to continue. That means fewer extra-base hits, fewer hard-hit balls, and a lower batting average and, ultimately, on-base percentage. Friedl currently owns the second-highest difference of batting average to expected batting average in MLB, with a mark of .044.
Right back to the Reds with Gavin Lux
Sticking with Cincinnati for our second hitter, we come to Reds outfielder Gavin Lux. Lux's numbers on the season in terms of batting average look good; he's slashing .296/.383/.408 entering play on Friday. However, like Friedl before him, a lot of that appears to be due for regression, primarily when it comes to his BA and SLG percentages. Heading into Friday's contest vs. the Cubs:
BA: .291
xBA: .257
BABIP: .398 (not sustainable with his lack of power)
SLG: .406
xSLG: .359
Among qualified players on the season, Lux is fifth in the league with a BABIP of .398. This will not be something Lux can maintain all season. We know that batting average and expected batting average will go up the harder you hit the ball, also raising your BABIP, and although Lux's hard-hit rate is currently above league average, it's safe to assume his hard-hit rate will lower if his BA and SLG are both expected to drop. To sustain a BABIP well above .300, Lux would have to hit for a lot more power, more slug, a higher hard-hit rate, etc., and that is not the direction his metrics are trending.
Although we don't exactly have two superstars on this list, these are the two that appear to be getting the luckiest. Things can change, however, and these two players aren't necessarily doomed in 2025 because of a few advanced metrics that suggest regression. Typically, advanced metrics and analytics exist because of their historical accuracy, and it will be interesting to see if they are on the money with Friedl and Lux, who are both currently experiencing marks well above their career-average.
