
Key Points
Bullet point summary by AI
- Wind direction at Wrigley swings scoring by more than 3 runs per game.
- The park plays like two completely different environments depending on the wind.
- This pattern challenges conventional wisdom about temperature's impact on offense.
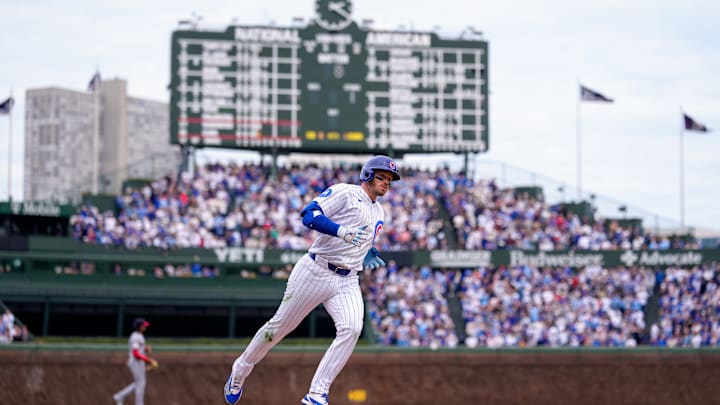
Ian Happ stood in the batter’s box this past weekend and did what hitters at Wrigley Field have done for over a century: looked up at the flags. The wind was doing something. It always is. But how much does it matter?
Five seasons of Chicago Cubs home game data — 410 games from 2021 through 2025 — tells a story MLB pitchers have always known intuitively: Wrigley Field is not one ballpark. It’s two. And the wind off Lake Michigan is what determines which one shows up.
Wind direction swings scoring by more than 3 runs per game
- Wind blowing out: 10.95 runs per game
- Wind blowing in: 7.72 runs per game
- Difference: +3.23 runs per game
- Strong wind: Swings it to 4.64 runs
When the wind blows out at Wrigley, games average 10.95 runs. When it blows in, they average 7.72. That's a 3.23-run swing per game, a 42% difference in total offense between two versions of the same park with the same dimensions and the same ivy on the walls. Push it to strong wind, 10 mph or more in either direction, and the gap widens to 4.64 runs per game: 11.76 out, 7.12 in.
That's not a rounding error. That's the difference between a laugher and a pitcher's duel, decided before the first pitch by something no manager can control.
The extremes make it visceral. The five highest-scoring wind-out games in the dataset produced 29, 25, 24, 24 and 23 runs. Three of the strongest wind-in games produced a single combined run each, two major league offenses across nine innings totaling one run while the wind howled in at 17, 12 and 22 mph. Those aren't anomalies. They're Wrigley doing exactly what Wrigley does.
April is secretly Wrigley’s highest-scoring month

There is a point where this little exercise goes sideways and gets genuinely counterintuitive. April at Wrigley is cold: 52.4°F average game-time temperature, the coldest month in the sample by a wide margin. Cold air is dense air. Balls don't carry. The conventional wisdom says early-season Wrigley should be a pitcher's park.
But it isn't. April produces 9.69 runs per game, the highest of any full month in the dataset. More than June (9.63). More than warm July nights (9.07). And more than August (8.47).
The reason is wind direction. In April, 41.8 percent of Cubs home games have wind blowing out, and only 32.8 percent have it blowing in. April is also the windiest month in the sample at 10.1 mph average. The cold air costs distance. The wind gives back more. What looks like a pitcher's environment is actually one of the most volatile scoring environments in the building's entire calendar.
How Lake Michigan turns Wrigley into a pitcher’s park

In May, the wind blows in from the lake in 63.9 percent of Cubs home games. Out in only 23.6 percent. Run scoring drops to 7.82 per game, the lowest full month in the dataset, despite conditions that look friendlier for hitters on paper.
This is the Lake Michigan effect. As air temperatures warm through late spring, the lake stays cold. Cold air sitting over the water pushes inland toward the park, blowing toward home plate. It's a meteorological pattern that repeats year after year, and it converts Wrigley into a genuine pitcher's park through the stretch of the season when most fans expect the opposite.
The pattern holds through summer. Wind blows in 48.4 percent of June, July and August games and out only 27.7 percent. The heat helps some, averaging 9.03 runs per game across those months, but the prevailing wind direction is suppressing offense more often than not. Temperature is real. It just isn't the main character.
Temperature matters, but wind decides everything

Games at 80°F or warmer average 10.53 runs per game, the highest of any temperature band, and that signal is real. Hot air is thin air; the ball carries farther. But games below 50°F still average 8.90 runs per game, actually higher than the 50-60°F band (7.88) and the 60-70°F band (8.29). The coldest games at Wrigley outscore the merely cool ones because cold April days are also the days when wind is most likely to be blowing out.
Strip wind direction out of the temperature analysis, and the numbers flatten. Put it back in, and they make sense. At Wrigley, temperature tells you how far the ball might carry in neutral conditions. Wind direction tells you whether those conditions exist.
What this means for the Cubs' 2026 season
The early weeks of this season fit the pattern precisely. April wind at Wrigley is aggressive and predominantly outward. Games will be chaotic and high-scoring by reputation while feeling like they shouldn't be given the cold. By Memorial Day the lake will have reasserted itself, the wind will shift, and the park will quietly become something different.
At Wrigley, the most important pregame decision isn’t the lineup card, it’s which way the flags are blowing. Five seasons of data across 410 games says checking them is worth 3.23 runs per game. And at Wrigley, that's the whole ballgame.
Data via Retrosheet game logs, 2021-2025 Cubs home games (n=410). Wind direction categorized as out (tocf/tolf/torf), in (fromcf/fromlf/fromrf), or crosswind (ltor/rtol). Weather data sourced from official box score reports; NOAA historical data for Chicago Midway Airport