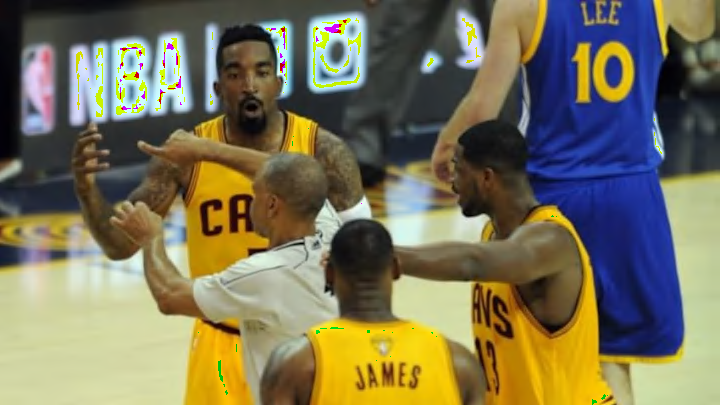
After the second game of the NBA Finals, league officials reported that the referees had made a number of bad calls in overtime. The mea culpa naturally garnered media attention, though everything seemed to be forgiven since Cleveland (the aggrieved team) emerged victorious. Still, an important issue remained: how exactly did the incorrect officiating decisions affect the game?
To answer this question, we can analyze Cleveland’s win probability and determine how different it might have been with proper calls. Such an analysis makes sense because win probability is the “ultimate story statistic“: it sets specific events within the overall context of the game to see how they affect the outcome. In baseball, Tom Tango once examined how fan interference impacted game 6 of the 2003 National League Championship Series. We can apply the same thinking to the current NBA Finals.
Based on the Last Two Minute Reports, here’s an overview of officiated events for games 1 – 4:

Game 2 has seen the most officiating errors, with all four being incorrect non-calls in overtime. Interestingly, thus far, all six officiating errors in the series have been incorrect non-calls.
The following tables examine these errors in greater detail. For each call, we can see the Cavs’ win probability at the start of the sequence, based on Michael Beuoy’s outstanding Inpredictable model, which draws from play-by-play data since the 2000 NBA season. We can then see their ending win probability as a result of the error, followed by what it could have been if the correct decision were made. Comparing these two numbers will help us estimate the impact on the Cavs.


Since the game 3 errors effectively cancel each other out, we’ll focus on game 2. The analysis shows that, in the latter contest, the four incorrect decisions collectively hurt the Cavs by about 30% in win probability. Let’s look closely at how they made it more difficult for Cleveland to claim victory:
1. Missed foul by Draymond Green during the overtime jump ball (-8.4% WPA).
This play is a great place to start, as it highlights the value of possessions and reveals some assumptions of my analysis. It can be broken down into the following components:
- As the jump ball took place, Cleveland’s win probability was 50%.
- Green’s foul should have given the Cavs possession, raising their win probability to 54%.
- But the refs missed the call. As the play continued, the Warriors secured the ball, putting Cleveland’s win probability at 46%.
The incorrect decision amounts to a -8% win probability added from the Cavs’ perspective.
Of course, I assume that the overtime period starts off with the teams at 50-50, just to keep the calculations simple. A more sophisticated analysis would account for Golden State’s relative strength as measured by pre-game odds, which would have pegged the Cavs’ opening win probability at 32%. Still, based on a few preliminary checks, the magnitude of the missed foul itself seems largely the same.
2. Missed travel violation by LeBron James (+14.5% WPA).
3. Missed shooting foul by Andre Iguodala against James (-19.1% WPA).
This five-second sequence contains two distinct (yet intertwined) plays. The NBA unpacks them in its report, so the WPA analysis should follow suit.
In the first part, James’s travel violation should have led to a change in possession and a 14.5% decrease in Cleveland’s win probability. It’s a larger WPA than the jump-ball play because the game is down to its final 1:37, with the Cavs clinging to a one-point lead.
In the second part:
- Iguodala fouled James, who should have subsequently taken two free-throw shots and raised Cleveland’s win probability by about 5%.
- Instead, the play continued; the shot clock expired; and the Warriors gained possession–a -14.5% WPA.
With the initial bullet point, I use the average of James’s free-throw percentage over the past three years (74%, in line with his career 75% mark). I also assume that, if he misses the second free throw, there’s a 19% chance of an offensive rebound and keeping the ball in Cleveland hands. Again, we can strengthen the analysis by using more team-specific weights, but the preliminary estimate should work. Overall, the incorrect decisions harm the Cavs by roughly 5% in win probability.
4. Missed foul by Green on another jump ball (-17.2% WPA).
This play finds Green in a jump-ball situation yet again, with the Warriors still down by 1 and only 45 seconds left:
- As the sequence began, Cleveland’s win probability was 59%.
- Green’s foul should have led to a Cavs possession, raising their win probability to 76%.
- Instead, the play continued; James committed a violation; and the Warriors gained possession. It kept the win probability at 59%.
In this case, I assume that, prior to the jump-ball, Golden State technically had possession, which is why Cleveland’s starting point is just under 60%. The assumption is based on the official play-by-play logs, where a “Warriors rebound” precedes the situation at hand. Despite the similarity with the first play, it has a higher value because the game clock is below the one-minute mark.
Implications
Altogether, in NBA officiating parlance, the incorrect decisions “disadvantaged” the Cavs to the tune of about a third of a win. Beyond Game 2, we could conceivably extend such an analysis to an entire series or any other case where the likelihood of an outcome is in question (e.g., making the playoffs). The most vital takeaway is that we have the analytical tools to measure the impact of what was once left to intuition.
