NBA Position Estimates 2014-15
By Seth Partnow

I’ve been writing a whole lot recently about positional aggregates and averages in a way to help define, if nothing else, a baseline against which to measure the so-called positional revolution. At various times in the process, I’ve complained about the lack of reliable position assignments and estimates. Basketball-Reference.com has a good first pass, but that’s mostly sorting lineups by height and filling positions accordingly. This leads to pretty good results in the majority of cases. That general level of accuracy leads to certain cases sticking out even more, however. Over the weekend, I noted one in terms of Harrison Barnes being assumed to play “bigger” than Draymond Green, and other examples include Kevin Love over Tristan Thompson, Ryan Anderson over Anthony Davis and so on.
In the grand scheme of things, this is no big deal. “Position” is much more a descriptive than evaluative characteristic, a helpful method of grouping like things together. [1. Of course, those things can become less alike than initially thought upon any sort of close investigation. For example, the many different ways “Point Guard” is played in the modern NBA.] At times, those categories become important evaluatively as well. Rim Protection is largely dependant on defensive proximity to the rim, and knowing what “slot” in the lineup a player is occupying can serve as a very useful proxy for that information. Therefore, while position might not be a necessity to know with greater accuracy, it is nice. And I want it.
So I decided to make my own estimates for the entire league. Since I’m using them so much and complaining about not having good numbers, it seems the least I could do.
The method was actually pretty simple in concept.[2. Though slightly more difficult in coding execution, as my poor old laptop begins to whine when I start running loop functions on 600,000 rows of data.] I took every player who appeared for each team in 2014/15 and “force ranked” them from “smallest” to “biggest” in terms of position played. I then assigned the 1-5 positions to each team for every line of the 2014/15 play-by-play log, solved for minutes and presto.[2. Full list is here, feel free to copy and use at your own leisure.]
Of course, this still isn’t perfect. Situations arise like that in New Orleans where a lineup with Jrue Holiday, Eric Gordon and Tyreke Evans would have those three playing PG, SG and SF in that order, but if Holiday was out of the lineup, Evans would take over the PG duties. With more time and a lot more game tape study, I could probably pick out a few more similar examples[2. Lineups when LeBron is actually playing PG for example, or who is filling which roles when Utah had neither Burke nor Exum on the floor last season.] But it is for the most part better, and that’s a relatively simple fix[5. This is another benefit of the simplicity of the approach. I know exactly why the numbers for Gordon and Evans are skewed, which might not have been the case had I tried to wrangle some sort of playmaking/rebounding/rim protection fit model together which would have added huge complexity for a minimal, if any, increase in accuracy over my, if I may, well-educated eye test of how teams were actually running lineups.].
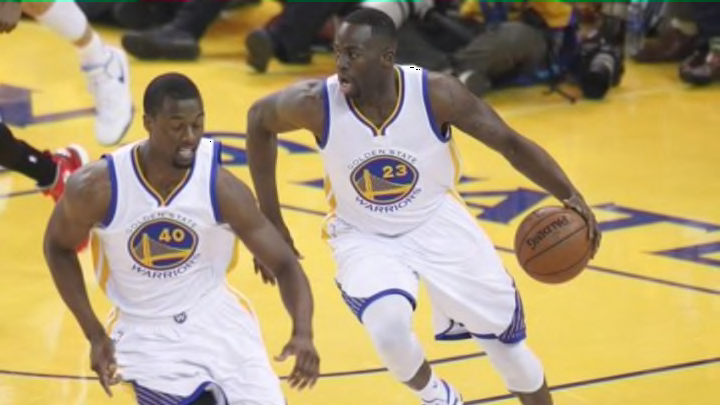
An added bonus is that since I’ve tied the lineups to play-by-play logs, I can much more easily discern such things as how well say Anthony Davis shot while playing center (57.8% from the floor ) vs. playing power forward (51.6%), or if Golden State’s defensive rebounding went into the tank when Draymond Green played center[1. On missed field goals only, the Dubs had a DREB% of 75.7% with Green at PF and 73.4% with him at center. Interestingly, their own offensive rebounding also improved with Green at center, going from 23.9% to 26.5% of missed FGs.].
In addition to the linked google doc, I’ll add a sortable table of 2014/15 position estimates in the Our Stats section in the next day or so. Edit: And here it is:[8.
]