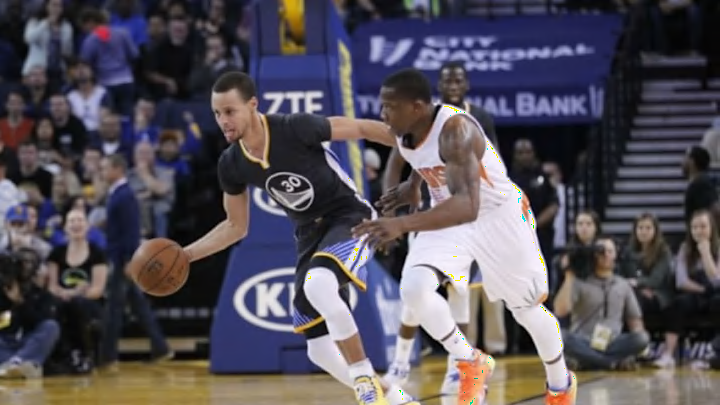
I’ve recently looked at offense creation in the half court, both on the team and individual player levels. In those examinations, I think the necessity of having players who can disrupt a set defense becomes clear. Of course, the best way to beat a team with a quality defensive scheme is to avoid it, getting as much offense as possible in situations where those well-drilled defensive principles don’t have a chance to kick in. One way to do this is by crashing the offensive glass. The chaos after a scramble for a rebound often leads to quality quick shots on putback attempts. The other method is by looking to score in transition. Beating the opponent end-to-end can be far easier than trying to manipulate them out of place side-to-side..
Of course, every team says they want to run, to get easy buckets. But it doesn’t really happen that way as some teams are simply more adept at playing faster than others. It isn’t just a matter of raw pace, shooting quickly, but of creating numerical advantages and exploiting them.
I’ve never been particularly happy with “pace” as a statistic, at least not as a measurement of anything with much meaning beyond simple possessions counts. So many things can cause the pace statistic to diverge from what we are really looking for the stat to measure, which is speed of play. Offensive rebounds, particularly good or bad defense[1. Good defense can slow “pace” by denying early shot attempts on the first few options of an offensive set, while bad defense can goose pace by doing the reverse.] or even something crazy like the employment of a “hack-a” strategy can cause the number of possessions to expand or shrink in ways that don’t readily reflect the quickness of a team’s offense.
To better account for a team’s ability to “get out and go” or prevent the opponent from doing so, I decided to create a quick and dirty measure of “Transition %.” By dividing the number of transition possessions[1. As determined by Synergy play type stats.] by the number of “opportunities”[2. The sum of a team’s steals and defensive rebounds since those are by far the most common means of generating a fast break.], and doing the reverse for a team’s defense, we can determine a offensive and defensive transition percentages:
Interestingly, at least last season, there was a decent correlation between offensive and defensive transition in that the faster a team played offensively, the more they tended to give up defensively. Whether this is simply an empirical observation from 2014/15 data or a discovery of a more ironclad relationship, we probably need a few more seasons of data to have a good idea[7. As an aside, there was some tendency for teams which got into transition more frequently to also be more efficient in terms of transition PPP, while there was no discernible relationship between propensity and proficiency in terms of transition defense.]. Visualizing this correlation graphically produces something of further note:
Teams appear to have formed into three strata:
- Those that play “faster” than opponents, getting out in transition themselves while preventing the opponent from doing so – these are the teams “above” the trend line.
- Teams that play at average speeds, running about as much as they allow their opponents to run – these teams are more or less on the trend line.
- Teams that play slow, allowing more transition they themselves record – these teams are all safely “below” the trendline.
And in fact, by simply subtracting “defensive transition %” from “offensive transition %” we can derive a sort of “Speed Index” for every team. It’s quick and not especially rigorous, but a measure that has Golden State, Phoenix, Houston and Denver as among the fastest teams and Charlotte, Chicago, Memphis and Indiana as some of the slower playing teams in 2014/15, it might be on the right track.
