TeamSPACE: The Chart of a Champion
By Matt D'Anna

Welcome back, friends.
Last offseason, I attempted to analyze the similarities and differences of every NBA champion since 1996-1997. Specifically, the goal was to study shot patterns among the Starting 5 for each champ (more affectionately known as Hunting Grounds). The key to these TeamSPACE charts was to blend together all of a lineups’ Hunting Grounds and study the combined areas. Specifically, by measuring the overall percentage of the court occupied and the overlapping shooting space, we gained insights into how that grouping works best together. Once you’re able to power through all of the Tribe Called Quest subtitles, the main takeaways were relatively straightforward:
- Most championship teams use 7-9% of the court
- Over time, total space is remaining relatively the same (slightly shrinking), and overlapping shot areas are growing
- There’s a negative correlation between total court space and field goal percentage, and a moderately positive correlation between total court space used and average shot distance
So…
- The seven franchises with rings since 1997 somewhat neatly organize into Superstar-centric (more total court space and less overlapping area) and Team-centric (less total space and more overlap) shooting patterns.
- Superstar-centric: Bulls, Lakers, Mavs
- Team-centric: Spurs, Pistons, Celtics, Heat
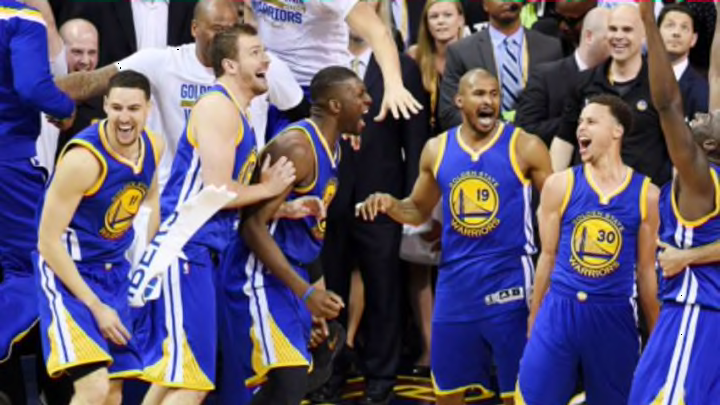
Given what we thought we knew, how does last season’s champion, the 67-win Golden State Warriors, measure up?
Average Shot Distance
So much for average. Last season’s Warriors are a barely-noticeable shade behind the 2010-11 Dallas Mavericks for the longest shot distance among prior champions. Those two teams were shooting a full 2ft farther away, which equates to a whole lot of three-pointers. Of the nine teams in league history to attempt more than 2,200 three pointers in a season, the Dubs 39.8% shooting is the best…by a wide margin (the 2012-13 Knicks are 2nd, at 37.6%). Games like this should surprise no one:
Hunting Grounds
This lineup was something special. There is some brilliance in how these five players organize across the court. In the modern NBA, where maximizing opportunities at the rim and behind the 3pt arc are ideal, the Warriors perfected it. There are four legitimate, need-to-be-guarded treats from deep. Part of the brilliance is how each of the four still maintained their own 3pt identity; while there is plenty of overlap, it generally cascades from one player to the next. It’s the result of a great offensive scheme mixed with talented players. Combined with Bogut’s lack of a need for systematic touches, it’s a rare blend that took the league by storm.
When you mash them all together, it becomes even more beautiful:
The overlap is in all the places you expect (and want) it to be: at the rim, in the corners, and scattered above the break from deep. There are also these hints of midrange, in particular at both elbows. Likely the result of pick-and-roll, there’s just enough to keep a defense on its toes. Overall, this is the good/intentional overlap I’ve been preaching for years now. In 2015, if you wanted to build the perfect shot chart from scratch, I’m not sure how much different from this it would look.
Court Usage
Usually, an NBA champ is both high on percentage of total court space and high on percentage of overlapping space (and vice versa). Less often do you see a team with relatively low levels of court space and high overlap. However, as you can see the Warriors are in rare company, snugly clustered with the 2003 and 2005 San Antonio Spurs as the exceptions to the trend. There’s really no other grouping that tightly packed.
Best Comps
There’s clearly no perfect comp to last season’s Warriors. From this unique overall-to-overlapping idea, these two Spurs teams are probably the closest. While the glaring difference is 3pt activity, the pattern is very similar: gobs of overlap in the places you want it to be. While the midrange is more occupied in San Antonio, this is expected when comparing Tim Duncan to Draymond Green.
And even here, despite similar types of three-point activity, the midrange Hunting Grounds are much different. And again, this is what happens when you compare Dirk Nowitzki to Draymond Green. Remove all that midrange baseline activity and clean up the elbows, and this starts to look like those Spurs-teams-with-a-three-point-shot, aka the 2015 Golden State Warriors.
So What?
Last season, the Warriors shot like the 2011 Mavericks and spaced the court like the 2003 and 2005 Spurs. That is a truly unique, relatively unheard of style. Is this the peak of the this style, or just the beginning? Is this the new model of champion? Is this the latest innovation in the Team-centric shot patterns? As more teams tinker with Small-Ball lineups, does the next champ emulate this model, or buck the trend? If this offseason was any indication, we are only getting started. At a glance, the teams closest resembling this style heading into this season are the Warriors, Rockets, and Spurs. If we see a reversal and the contrarian Superstar-centric style prevails, the Cavaliers, Thunder, and Clippers have the best shot at some Finals hardware.
Data and photo support provided courtesy of NBA.com, Basketball-Reference.com, and data extraordinaire Darryl Blackport.