

One of my favorite things about exploring basketball and the NBA specifically from a quantifiable perspective is the sense of shared curiosity. Though it can occasionally feel like a homework assignment, the constant stream of “but what about…” questions can stop you in your tracks thinking “what about that indeed?” One such question which came across my plate recently is from reader Rodrigo Gomez, who wondered if I had or had seen any data on which players play more against starters or bench units. I didn’t have that data, but now that I thought about it, I wanted it.
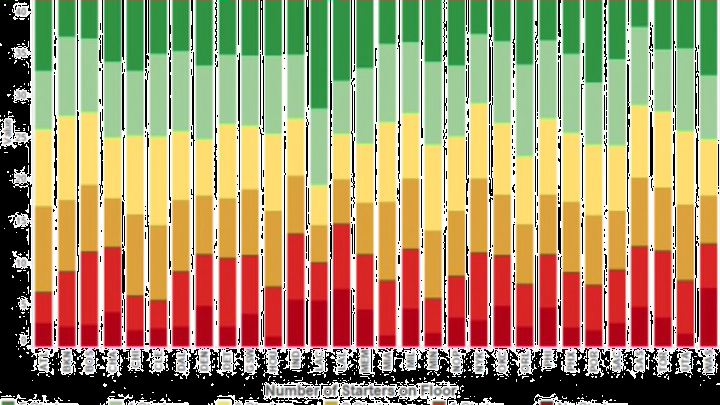
So I went back through the play-by-play logs from 2014/15 and determined how many starters were on the floor for each team for every event. In first broad strokes, here’s how each team deployed their own talent:
It’s always quite surprising how little team’s starting 5’s actually play together, but for reference sake, NBA average was just under 14 minutes per night per team. The Clippers clocked in at just under 20 minutes per, while the Spurs were the lowest at just over 10. As the chart below shows, teams generally play about half the game with between 2 and 4 starters on the floor, leaving right around 10 minutes per night for lineups with 1 or no starters. In non-blowouts, the prevalence of full “bench mob” units is probably even lower, but that might require further study.
Moving on to individual players, the following chart shows playing time and shooting splits against Starters (lineups with 4 or more starters) and Bench (2 or fewer starters) units. It will also be posted under our stats for future reference:
Much like the positional playing time estimates, the possible applications of this data are many, and there will be more to come building on this as we get into the new season.