On cue for the new season, late last week the good folks NBA.com gave us and Nylon Calc and the rest of the stats-curious community a little bit of a goodie bag in terms of the improvements and additions to the suite of publicly available SportVU data[1. I can not emphasize enough how comparatively little of what SportVU data might provide is contained in these public reports. Especially in tandem with charted data like Synergy or Vantage, there is a lot more to be unlocked.]. The biggest improvement is the ability to filter all previously available stats by date which both allows for more accurate totals[1. A problem with the old method of displaying the information is that even tracking the stats day-by-day led to some inexactitude once games played got into the double digits, as the per game averages were only provided to a single decimal place. This led to fairly wide estimates in identifying whether a player might have defended many more shots at the rim or had far fewer potential assists than normal, as the “more or less than normal” was easily subsumed in the “plus or minus 4 or 5” of the estimate. No more, I say!] and the game-by-game “boxscores” which Darryl introduced earlier today.
In addition to these refinements, there is some genuinely new information. In particular, the drives tab has applications to a subject near and dear to my heart as a largely unexplained phenomenon, which is to say playmaking[1. See here, here, and here for some examples]. Dribble penetration is a good thing, it leads to such things as the defense collapsing allowing kickouts for open threes. Shots at the rim. Free throws. Basically the tenets of MoreyBall wrapped up in one little action.
Qualitatively, not every drive is created equally. Some guys careen into the lane out of control. Others are dominant finishers, while some are barely even looking to score when they get into the line. These are all things than could be gleaned from careful observation, but the slightly more detailed data allow these differences to be weighed just a little bit better.
For example, if we want to look at the players who are most or least looking to score on their drives, we can compare shot attempts and times fouled against passes and see that while Joe Ingles of the Jazz passed on more than than twice as many drives as he attempted to score, Rudy Gay was more than nine times as likely to attempt to score as make a play, the highest in the league among players with 200 or more drives last season[1. Even with the new data, these remain estimates, close estimates, but still estimates. Players appear to be credited with both a field goal attempt and with getting fouled on drives where they collect an “and one.” There isn’t enough information to determine whether drives on turnovers should be termed passing plays, scoring attempts or the occasional “neither” of a ball dribbled off a foot. Finally, there are an uncertain number of plays where a player drove to the basket, and then dribbled right back out, a la Steve Nash. There is enough information to guestimate the prevalence of those events, but not much more.].
As Gay’s role is to score, that might not be terribly worrisome, aside from the possible insight it can give to opposing coaches in preparing scouting reports. “If Rudy puts it on the deck, help aggressively” might be the instructions, because if he’s unlikely to pass, might as well challenge the eventual shot, right? For some players, this ratio is more concerning. For example, among that same sample of 99 players Derrick Rose had the 9th highest scoring-to-passing ratio, averaging a shade under 4 scoring attempts per kickout or dump-off[1. NBA average on all drives was around 2.1 scoring attempts per pass.]. While Rose finished reasonably well on his drives, the lack of assists combined with a high turnover rate[1. He had more turnovers than assists on drives last season.] is a little concerning, and something the Bulls new offense under Fred Hoiberg might hope improves. Similarly, Zach LaVine was much more looking for his own offense than for teammates when he penetrated, lending further credence to the theory his best eventual position is at the two.
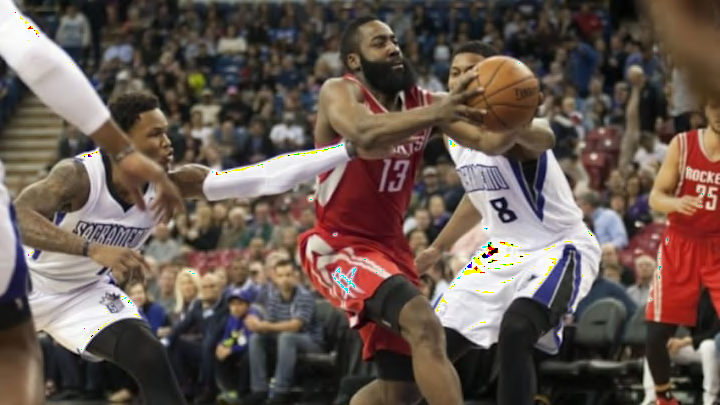
Looking at those who used the drive to set up teammates, the top of the assist-to-turnover list is full of some expected and one perhaps surprising face. Four players averaged more than 2.5 assists from drives per driving turnover last year, John Wall (2.55 A:TO) , Ty Lawson (2.59) , Chris Paul (2.61), and the runaway leader Devin Harris (3.27). James Harden checked in at 13th, at just under 2 assists per tunrover, a surprisingly robust figure for a player looking to score on his drives as much as the Beard – the only other players to average over 1.5 assists per turnover while also attempting to score more often than average on drives were J.J. Barea, Jordan Clarkson and Mike Conley:
There is probably plenty more investigating to do here, especially in terms of how to integrate the additional detail into my Point Guard Style descriptions. But for now, the following chart collates some of the stats listed above:
