Freelance Friday is a semi-regular series at The Nylon Calculus where we invite submissions from readers and practitioners in the hope of making basketball analytics more democratic and inclusive. Submissions, questions and comments can be directed to TheNylonCalculus at gmail dot com.
Today’s submission is from Max Schimanski who previously detailed a method for grading the value-added of NBA free agent contracts. Max is a member of the “Cats’ Stats” group at Davidson College where he and other students provide analytic and statistical support to a number of sports teams including both the men’s and women’s basketball programs. Max is pursuing a degree in Economics with a minor in Applied Mathematics. You can find him on Twitter at @schimax.

The NCAA Speed Index
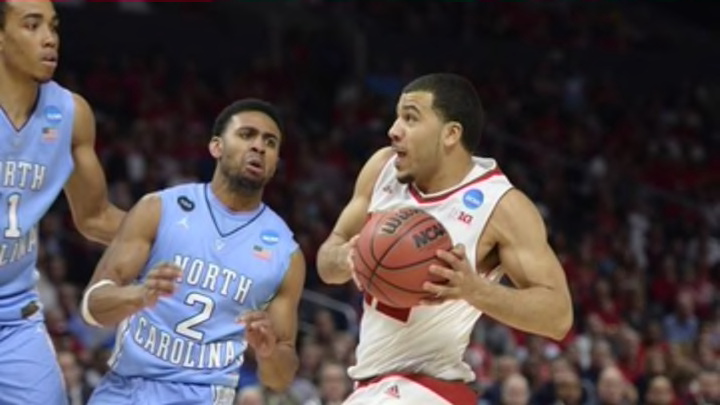
In basketball, scoring points comes in a variety of forms, especially in the college ranks. The University of Wisconsin, for example, historically has played at one of the slowest rates in college basketball. Using a slow, methodical offensive attack, the Badgers often use the full shot clock to probe a defense in order to find a quality shot. On the other end of the spectrum, the North Carolina Tar Heels historically prefer to get up and down the floor quickly, attempting to score before the opposing defense has time to get set. Each of these offensive strategies has the capacity to be effective, as both of these teams ranked in the Top 30 in Points Per Possession in the 2014-2015 college basketball season.
Since college teams significantly vary in their offensive speed, quantifying pace allows for numerical comparison of teams’ offenses. The value of such comparisons depends, of course, on the underlying metric. One of the most accepted measures of pace is simply the number of possessions that a team creates per 40 minutes. This statistic certainly does give viewers an indication of how fast a given team plays on offense, as more possessions per game mean a shorter, quicker time of possession.
However, possessions per 40 minutes statistics gives little or no indication of how well or how poorly a team may defend its opponents pace of play. On top of that, a team’s pace statistic may be significantly affected by the pace of its opponents, offensive and defensive rebounding, and situations where fouling is necessary (i.e.: to extend a game).
The NBA “Speed Indexes” introduced by Seth Partnow back in October help bring these things into focus. These speed numbers, while not perfectly explanatory, do give viewers an interesting look at a team’s proportion of transition possessions and their transition efficiency. Not surprisingly, those same statistics can be applied to NCAA teams. Below is a graph displaying the average offensive and defensive efficiency of each NCAA Division I Men’s Basketball Conference:
On the side bar, each conference’s Normalized Speed Index is listed. The reason that Speed Index is normalized is because the average NCAA speed score is actually negative. This effect is caused by outlying teams in each NCAA conference with poor speed scores, forcing the average speed score to be pulled down. As a result, the Normalized Speed Score is the percentage that a conference is above or below the NCAA average Speed Score.
As one can see, conferences that are significantly above the best fit line on the graph are “faster” conferences, while teams far below the best fit line are “slower” conferences, on average. Interestingly, looking at both the Big Ten and Atlantic Coast Conferences, homes of the Badgers and Tar Heels, respectively, both conferences, on the whole, play a similar, fairly average pace. Both teams are significant outliers in their respective conferences, with Wisconsin being on the slower end of the spectrum and UNC being on the faster side. That being said, just because a conference plays at a seemingly average pace, teams must still be able to account for each and every individual team they face, as pace of play within each conference varies at different degrees.
Information like this is crucial to coaches, players, and even fans. Preparing for a fast-paced team can differ from preparing for a slower paced team, as a coach’s scheme may differ depending on the opponent’s pace preferences. For example, against a team that likes to get out in transition, a coach may be wary of crashing the offensive glass, and opt to send players back on defense instead. Here we see that conference play can result in such differences, which can be especially important if a team’s style varies or struggles against faster or slower paced teams.
Thanks to Dr. Tim Chartier, Abhi Jain ’18, and Ross Kruse ’17 for their contributions to this article.
