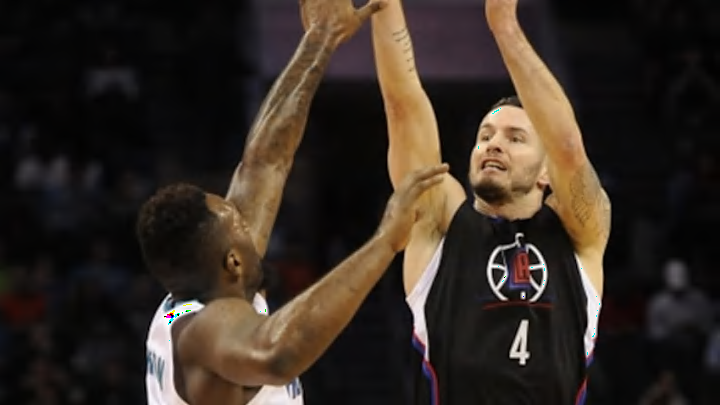
J.J. Redick has been red hot. Halfway through the season, he has compiled a 61.2 effective field goal and 65.5 true shooting percentages, both of which rank in the top five leaguewide. Among players with usage rates above 20 percent, he trails only Steph Curry and stands a few points ahead of other highly efficient scorers like Kevin Durant and Kawhi Leonard. His 48.9 field goal percentage, 50.0 three-point percentage, and 89.5 free throw percentage have drawn some comparisons to Kyle Korver’s spectacular performance last year.
Naturally, these numbers reflect improved production for Redick. Since 2014, his points per shot have risen from roughly 1.10 to 1.20, as the following chart shows:

Based on this growth, we might assume that Redick has benefited from better scoring opportunities. But when we look at Krishna’s Objective Basket Estimator (KOBE), which measures shot quality, we see that Redick’s expected points per shot has actually trended in the opposite direction, declining from 1.00 to 0.92 over the past two-and-a-half seasons:

Note that Redick played just 35 games in 2014, so his sample size during that season (397 FGA) was similar to his current level (376 FGA).[1. KOBE data for 2016 include all games through January 11.] It’s nevertheless clear that the difference between his expected and his actual points per shot[1. Which we’ve named “SHot Adjusted Capability.” Or SHAC for short.] has widened each year. Indeed, during this time period, Redick has the fourth highest SHAC in the NBA.[2. Among players with at least 350 FGA in 2014, 350 FGA in 2015, and 200 FGA in 2016.]
| Player | Total SHAC | Total FGA | SHAC Per FGA |
| Kyle Korver | 400.25 | 1,474 | 0.27 |
| Stephen Curry | 707.77 | 3,302 | 0.21 |
| Kevin Durant | 529.50 | 2,693 | 0.20 |
| J.J. Redick | 323.70 | 1,705 | 0.19 |
| Chris Paul | 414.83 | 2,508 | 0.17 |
| Dirk Nowitzki | 413.04 | 2,840 | 0.15 |
| LeBron James | 451.93 | 3,261 | 0.14 |
| Tony Parker | 247.88 | 2,080 | 0.12 |
| J.R. Smith | 239.06 | 2,040 | 0.12 |
| Kawhi Leonard | 233.04 | 1,992 | 0.12 |
This table is populated by a number of reputedly “good shooters.” That should be a given in some ways, since players with higher levels of true shooting talent are likely to outperform expectations (all else being equal). Redick’s inclusion suggests that he’s capable of exceeding his KOBE on a reasonably consistent basis.
At the same time, though, he’s the only player here whose expected and actual points per shot have diverged each year. His current 0.28 SHAC is only a shade below Curry’s. One wonders whether he can sustain this level of overperformance for the remainder of the year.
My objective is not to speculate whether Redick will match Korver’s 2015 production or whether his shooting will significantly cool down. Instead, I think it’s more constructive to examine the “underlying fundamentals” of his shot selection and why they might be dipping. Here are a few thoughts:
First, we might hypothesize that Redick’s been doing more on the offensive end, particularly with Blake Griffin’s injury, and his increased load has been chipping away at his KOBE. But this dynamic doesn’t seem to be at play. Redick’s usage rate is 22 percent, which is on par with his numbers from prior years, and his field goal attempts per 100 possessions remain flat as well.
On the other hand, while Redick’s three-point frequency has held steady, his midrange jumpers have risen. About 36% of his shots are between 16 feet and the three-point line — his highest rate from this distance since his rookie campaign. Within three feet of the basket, his field goal attempts are down to 5.5 percent, which is roughly half of what it was two years ago.
Similarly, Redick’s catch-and-shoot jumpers have dipped slightly from 53 to 50 percent year-to-year, although the slide has been mitigated by the higher proportion of three-pointers among them. Perhaps more notably, his pull-up jumpers have increased from 33 to 40 percent, with more of them coming on long twos.
Shot distance and shot types are among the key variables of the KOBE model, so it’s no surprise that Redick’s expected points would lower. His torrid pace has obscured some of these recent trends, but they’re worth monitoring whether or not he maintains his accuracy.
