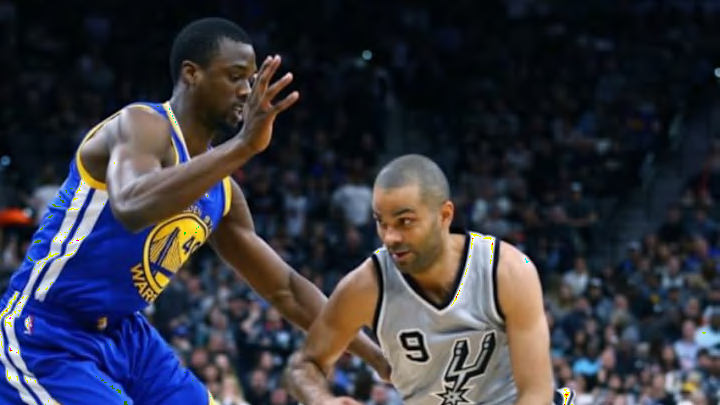
The NBA’s player tracking statistics have allowed to ask and answer all sorts of new questions over the past few seasons. However, most of the data has an offensive focus. This is not a complaint — defense is mostly about the absence of action which necessarily makes it hard to track. With some elbow grease, it is possible to contort some parts of the offensive offerings into a defensive data set.
Earlier this year, with the help of Darryl Blackport, I was able to work backwards with the public offensive drive statistics, connecting them with the defensive team on a game-by-game basis. This allows the aggregation of defensive drive statistics. That first attempt was back in November and I’ve finally had a chance to repeat the process for the entire season. The table below shows the same per game drive statistics the NBA shares, but these are defensive, reflecting drives allowed.
The way these statistics are tracked and collated include some inherent limitations. For example, while points scored and assists off drives are both tracked, points generated by those assists are not. That means the points per drive column is only showing the points scored by the ball-handler who completes the drive. Still, we are able to see some interesting defensive characteristics.
No team in the league allowed more drives per game this season than the Chicago Bulls. Their points allowed per drive, however, was just a tick above the league average. Their assists allowed per drive were also in the middle of the pack which implies that although they were letting ball-handlers get into the middle of the defense, it wasn’t hurting them quite as much as you would expect.
You can see a similar trend with the Miami Heat, who allowed the seventh-most drives per game, but held their opponents to the third-lowest field goal percentage on drives in the league. This would seem to highlight a defensive scheme that was often comfortable funneling penetration to Hassan Whiteside and letting him take care of defending the rim. The graph below highlights some of that relationship, charting each team by the average number of drives they allowed per game and the average number of points they allowed per drive.
The New Orleans Pelicans are their well established defensive issues are cringe-worthy. The Detroit Pistons stand out as another team that struggled defending drives, giving up a high number and a fairly efficient scoring rate. The Sacramento Kings show up surprisingly stout. Ranking as the second best defense in limiting drives and points scored per drive.
As with almost any other statistic, these defensive stats are not really appropriate as abstract measures of defensive effectiveness. But when paired with context and information about defensive scheme and what each team is trying to accomplish at that end of the floor, they can help illuminate who is succeeding in their own chosen structure.
