With training camp starting and the NBA doldrums finally ending, it is time again for me to release my analytically based win projections for every team in the NBA. For the last two years I have been using projections based on a blend of my Player Tracking Plus-Minus and a multi-year Regularized Adjusted Plus Minus via Jerry Englemann as player talent estimates, then weighted by estimates of expected minutes played.
For the past two years, my projections have been among the best at the APBRmetric projection contest as measured by average error or the root mean squared error (a non-linear error estimate). Those estimates also beat the Vegas over/under and the 538 projections both years.
The player metrics utilize multiple years weighted toward the most recent year, which tends to be a stronger indicator of performance for the upcoming year. In addition an age adjustment is applied and adjustments are made based on playing time, which I use as an additional estimate of player quality.
For the upcoming season playing time is estimated with adjustments made for depth by position and by generalized position categories like guards, wings and bigs. The projections are shown in the table below along with last year’s results and the expected change in total wins.
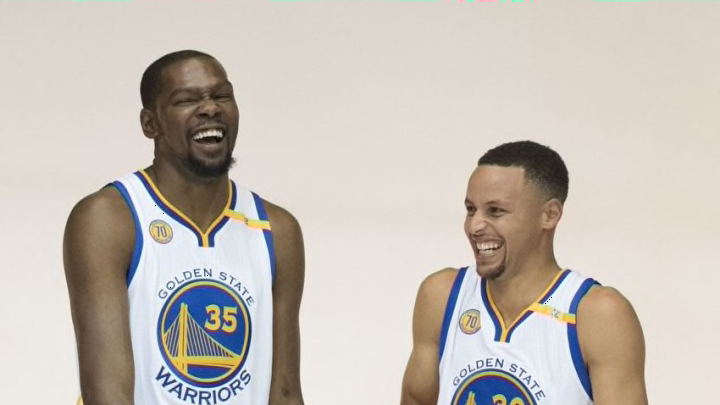
The headline has to be how good the model projects the Warriors to be next year, nearly matching last year’s record setting regular season run. Warrior’s coach Steve Kerr has been making noise about the intention to focus on the playoffs exclusively after last year’s historic collapse in the Finals. But, only fairly extreme assumptions on playing time reduction for the Warrior’s starters does much to move the needle on the model’s win projection. The Warriors simply have too many very good players, for example, Andre Igoudala is projected as the Warrior’s fifth best player, after Curry, Durant, Draymond Green, and Klay Thompson, but Igoudala would be the best player on eighteen of the other twenty-nine NBA teams.
In terms of big changes from last year the Oklahoma City Thunder stand out in declining expected wins, for obvious reasons. The Thunder are expected to be twelve games worse than last year, but remain borderline playoff contenders with 43 expected wins.
This year’s projections tend to fall into line with last year’s results leaving fewer upside surprises like last year’s Celtics prediction that had the Celts winning 49 games while the opening Vegas line had them at 40.5 wins.
Over/Under Lines
Another point of interest is always a comparison of the model’s results to the betting over/under line on wins for the season, shown in the chart below compared to Pinnacle Sports as of Monday, September 26.
There are a couple of more modest deviations from the Pinnacle betting lines. The model projections favor Houston, Golden State, Charlotte and Brooklyn compared to the line. The Brooklyn projection is pretty weak, the Pinnacle line has them at an abysmal 19.5 wins, while mean regression and Bro-Lin push the Nets to a slightly less abysmal 27 wins. The Rockets projection is one where the multi-year player projections push some of the role players towards a bounce back in expectations compared to last year, along with a steady dose of James Harden.
On the under side, my projections are much more skeptical on the T-Wolves than the betting lines, a full eleven and a half games under the betting line. Part of this is simply that many of the T-Wolves had big improvements from the 2015 campaign to last year. Factoring in both years, even weighted toward the last year and including an age curve indicates some regression this year. In addition, I don’t include a coaching adjustment, given how hard that is to reliably analyze. All that said, using my model’s past error rate weighted against past Vegas lines there would be about a 75 percent chance of the Wolves finishing on the under side of their current line.
Next: Kevin Garnett was MVP of his generation
As always, there are many limitations to my methodology. Though I adjust for depth, estimated player quality, minutes played and age, there are many fit issues, coaching and most injury issues remain outside of my estimates. And yes, my model hates your team.
