
")
This Saturday’s Final Four at the University of Phoenix Stadium marks the ninth consecutive time the NCAA’s marquee basketball event is played on a court laid atop the 50-yard line of a domed football stadium. And it marks 21 years to the day since the Final Four was held in an actual basketball arena. (From 1997 to 2008, the event was held in domed stadiums with the court positioned in one corner or end zone.)
Changing venue types enabled record crowds, but with it came controversy. Many have speculated that domes with the court at midfield – used in six regionals since 2008 and eight Final Fours since 2009 – negatively impact shooting, especially from long range. I investigated the so-called “dome effect” on ELDORADO and FiveThirtyEight last year, and I wrote an updated summary on the topic this year.
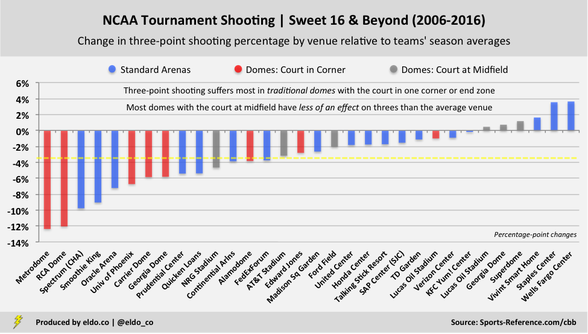
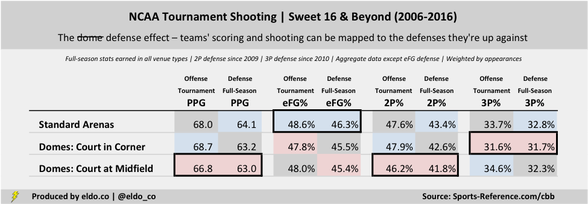
As held, the dome effect is a myth. In Sweet 16, Elite Eight, Final Four, and national championship games from 2006 to 2016, domes with the court at midfield played host to better 3-point shooting than any other venue type, including standard arenas; nearly all such domes have had less of an effect on 3-point shooting than the average late-round tournament venue; and you can pretty cleanly map teams’ offensive performance in each venue type to the full-season quality of the defenses they’re up against. These observations hold up to various controls and are supported by statistical testing.
Teams in domes do score fewer points per game
If you dive back into those stats and stories, you’ll see that NCAA tournament teams nevertheless score fewer points in domes with the court at midfield than they do in standard arenas. Vegas is on top of the trend — reports indicate that bookmakers set over-unders a few points lower for games in domes-midfield than they would for games in arenas (“about four points lower” in NRG Stadium and “slightly [less]” elsewhere).
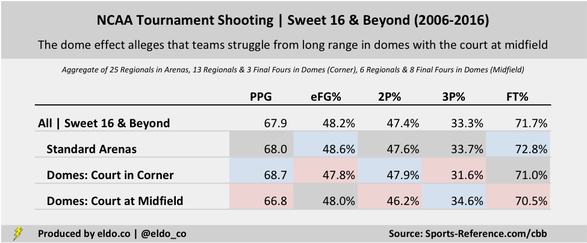
On its face, the bookmakers’ adjustment appears to be on target. From 2006 to 2016, Sweet 16, Elite Eight, Final Four, and national championship games played in domes-midfield averaged 2.3 fewer points per team than those in standard arenas, or 4.7 fewer points per game combined. (NRG Stadium averaged 2.2 fewer points per team per game than regular arenas, or 4.3 fewer points per game in all.)
But let’s peel the onion back a little further. It’s also been suggested that bookmakers consider teams’ reliance on outside shooting when setting lines for tournament games played in domes with the court at midfield. If so, then Vegas — like so many players, coaches, pundits, and fans – seemed to have bought into the misguided tenets of the dome effect. (Again, teams shoot 3-pointers best in domes-midfield.) So let’s take a closer look to see what’s really to blame for the lower point totals in domes.
Deconstructing that scoring differential
First, it’s important to account for overtime. From 2006 to 2016, there were eight overtime games (nine periods) in the Sweet 16 or later in standard arenas (75 games) and only one overtime period in a newfangled dome (42 games). Remove overtime scoring – as I did in my original analyses – and that 4.7-point difference between standard arenas and domes with the court at midfield falls to 2.3 points:

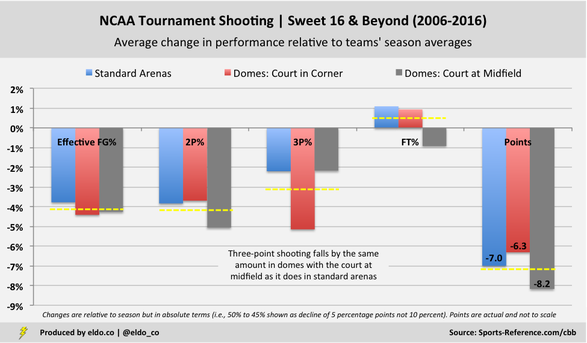
Next, let’s look at specific shot types. Late-round teams convert a higher percentage of their 3-point attempts in domes-midfield (34.6 percent) than they do in standard arenas (33.8 percent). But teams in domes-midfield attempt fewer 3-pointers on average (17.2 per team per game in regulation) than teams in standard arenas (17.9). As a result, we can trace 0.5 points of the 2.3 total-point differential to 3-pointers – but all because teams in domes-midfield shoot threes less, not because they shoot them worse.
We see the exact opposite with 2-pointers. Teams in domes-midfield have a lower 2-point field goal percentage (46.2 percent) than they do in standard arenas (47.5 percent), but they average 1.4 more 2-point shot attempts per team in regulation. Taken together, teams in domes-midfield combine to score 0.6 more points per game by way of 2s than they do in standard arenas – offsetting what we saw with 3s.
That leaves us with free throws. From 2006 to 2016, teams playing in the Sweet 16 or later shot 70.5 percent from the line in new-style domes, compared to 72.9 percent in arenas. And teams in domes averaged fewer free throw attempts (18.1 per team per game in regulation) than teams in arenas (19.3). That means a late-round game in a dome-midfield averages 2.6 fewer total points from free throws than one in a standard arena. Unsexy as it may be, free throws are most to blame for the differential:

Defenses in domes are superior
These observations align with the full-season defensive trends of the teams playing tournament games in each venue type. On average, late-round games in domes-midfield feature 1.2 fewer points per team than similar games in regular arenas. Well the defenses that advance far enough to play late-round games in domes-midfield allow 1.1 fewer points per game over the course of the entire season than those playing late-round games in standard arenas. (The scoring offenses in each venue type are equal.)
Offenses in domes shoot more 2s and fewer 3s than those in regular arenas — well the defenses they’re up against allow more 2-point attempts and fewer 3-point attempts over the course of the season than the defenses playing late-round games in arenas. (Even still, it’s easy to wonder whether teams attempt fewer 3-pointers in domes in part because the unfamiliar layout makes them wary – a minor corollary effect. Fewer free throw attempts in domes might imply that referees are more whistle-shy in bigger games, or that defenses are more disciplined. The data tends to support the latter.)
If we still want to sniff around for some sort of dome effect, free-throw percentage might be a fun topic to revisit. But for now we can sit back, relax, and over-analyze everything that happens this weekend in Glendale.
Endnotes
The primary data source for this story was sports-reference.com/cbb. I used play-by-play data from ESPN.com to calculate and exclude overtime. Due to rounding, certain figures will not appear to sum correctly. This analysis excludes “traditional domes” with the court in one corner or end zone. For more on those, please see my original stories.
Comparing point totals with and without overtime is relatively straightforward, but excluding specific overtime shot attempts by type requires the aforementioned play-by-play data, which was not available for three overtime games in my sample. As a result, I calculated overtime shot-type averages for all available Sweet 16, Elite Eight, Final Four, and national championship games since 2006 — including those in traditional domes — and used the averages as a proxy for the three missing games. Because of this assumption, my point-differential attribution calculations do not sum exactly. In other words, 0.5 fewer points due to 3s, 0.6 more points due to 2s, and 2.6 fewer points due to free throws sums to 2.5 fewer points in domes relative to standard arenas — a little bit off of the true regulation point differential (2.3 points).
As noted, late-round teams in domes-midfield shot 70.5 percent from the free throw line since 2006, versus 72.9 percent for teams in standard arenas. For those curious, both sets of teams made 71.2 percent of their free throws over the course of the season — so it’s not like the teams shooting free throws in domes were worse from the line to begin with. The two sets of teams averaged almost exactly the same number of free-throw attempts per game over the course of the season too — so the starting point is the same there as well.
Next: Nylon Calculus -- Proliferation of high-usage NBA stars
Data includes Sweet 16, Elite Eight, Final Four, and national championship games from 2006 through 2016. The only exception to this is full-season defensive statistics related to specific types of field goal attempts allowed. Full-season 2-point attempts allowed are available since 2009. Full-season 3-point attempts and free throw attempts allowed are available since 2010. This creates a slight mismatch with the offensive statistics reported in the second chart, but they’re nevertheless worthwhile to note.