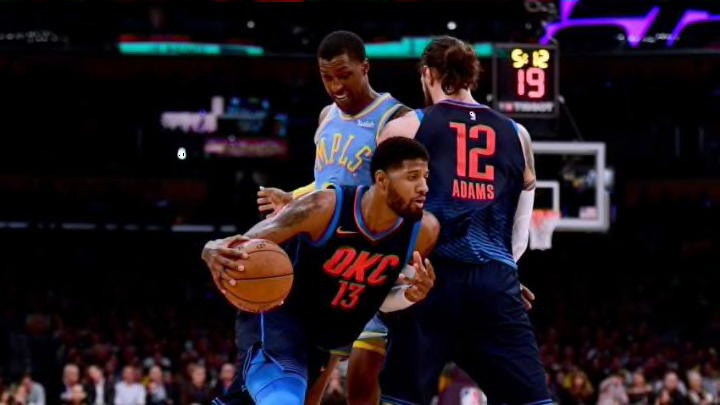
Halfway through the season, the Oklahoma City Thunder find their offense in a slightly better place than where it finished last year. They momentarily score 108.2 points per 100 possessions, roughly 0.2 points above league average. That’s a marginal improvement over their 2016-17 mark, when their relative offensive rating was about -0.5. Perhaps the “big three” of Russell Westbrook, Paul George and Carmelo Anthony can lead Oklahoma City to another level as the playoffs draw near, but through 44 games, their offensive growth has been fairly muted.
While overall progress has been limited, offensive tactics have noticeably changed in certain key areas. We can see the Thunder’s evolution through Synergy play-type data. As the following chart (which I’ve generated for all 30 teams and posted on presidual.shinyapps.io/nba-play-type/) shows, Oklahoma City has produced less efficiently with dribble handoff action and more efficiently off screens:

The Thunder have used handoffs just two percent of the time, generating a mere 0.6 points per possession — markedly lower in both frequency and efficiency than the league average (9 percent and 0.9 PPP). Granted, this play type was hardly a staple for them last season, but at least their performance then was closer to the other teams. By contrast, their production off screens (1.2 PPP) has risen toward the top of the NBA, matched only by the Denver Nuggets.
These changes are driven in large measure by personnel and strategic fit. Apart from the fact that both George and Anthony seldom created on handoffs in the past (it was often less than five percent of their plays), the Thunder also lost players like Victor Oladipo, who currently ranks among the most frequent DHO scorers, as well as Taj Gibson and Domantas Sabonis, who previously performed crucial functions on such actions. George, on the other hand, is a skillful shooter off screens. The Thunder are making the most of his comparative advantage and featuring it in their late-game Hawk set, among other schemes.
On the other end of the spectrum, the Miami Heat and the Detroit Pistons have ramped up their handoff usage, though to differing degrees of success.


The Heat have boosted their efficiency above the league average while engaging in the action about twice as much as the typical team. They have four players among the top 20 in total handoff possessions, with their two most frequent DHO scorers, Wayne Ellington and Josh Richardson, hitting 1.09 and 1.18 PPP.
The Pistons have executed handoffs an NBA-leading 12 percent of the time — significantly more than any other team since the data became publicly available three years ago. Indeed, they have already used this action on more possessions (546) than all but three teams did during the entire 2016-17 season. But efficiency has eluded them. Their PPP stands below league average at 0.8, with Avery Bradley (the NBA leader in raw DHO possessions) and Luke Kennard at the 30th percentile and Tobias Harris hovering under the 50th percentile.
Notwithstanding their performance on handoffs, the Pistons have taken steps forward in other areas, most notably those that relate to shooting. They’ve scored 1.06 PPP on spot-up jumpers, a top-three mark. Off screens, they’ve risen to 0.94 PPP, which still falls below league average but is much better than their bottom-three 0.8 last season. These improvements have coincided with their overall increase in 3-point percentage. While it remains to be seen whether they can sustain a 38-percent clip over time, it’s nevertheless encouraging for Detroit to build upon their 2016-17 numbers.
If you browse through the play-type app, you’ll see other teams who’ve made similar progress in shooting. The Brooklyn Nets have become more efficient in both off-screen and spot-up actions, aided by the addition of Allen Crabbe and, to a lesser extent, DeMarre Carroll. JJ Redick has helped boost the Philadelphia 76ers’ off-screen efficiency, just as the Nuggets and the Toronto Raptors have cracked the top three. Of course, PPP numbers are still liable to fluctuate, but in terms of the play types that teams prioritize, we likely already have a decent indication of them from the frequency rates.
Next: Nylon Calculus -- Stephen Curry might be having his best season yet
Note: Play-type data are current through Sunday, Jan. 14, 2018. All other data are current through Monday, Jan. 15, 2018.
