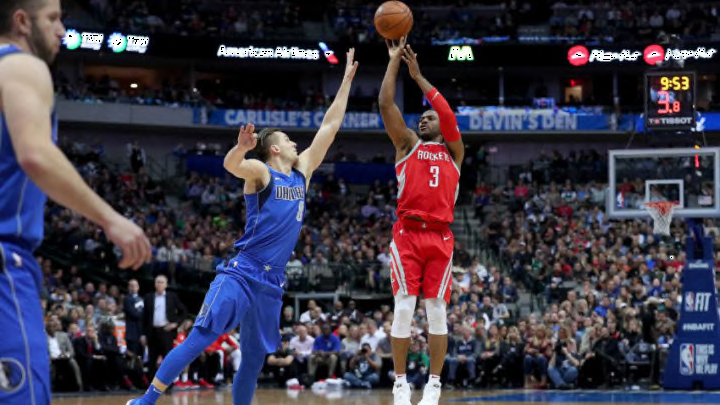
The Houston Rockets are shooting more 3-pointers this season than any team before in NBA history. They are on their way to breaking their own record from last season, and if they stay on their current course, they will become the first team ever to shoot more 3-pointers than 2-pointers.
The many 3-pointers have also translated into the second-best offense in the NBA. But commentators and writers have expressed concern — what happens in the playoffs, when the well of shooting luck dries up for Houston and the 3-pointers don’t find the net? Wouldn’t it be better to have some reliable 2-pointers?
I am not convinced that Houston’s offense is that much more variable than other NBA offenses. In fact, I believe that NBA fans are overestimating a great deal how much variance the extra 3s add to Houston’s offense, compared to the variance that is inherently present in an NBA offense.
This article expands upon an article I wrote here at Nylon Calculus last season. One minor detail has changed: In the old article, median absolute deviation was used as a robust measure of variability. In this article, I use standard deviation because we are actually interested in the outliers in offensive performance.

The histogram above shows every offensive performance for every team in the NBA. The teams are ordered by their standard deviation on offense. The San Antonio Spurs have had the highest standard deviation on offense, meaning that their offensive performances have been the most spread out.
The Houston Rockets have actually had the second-lowest standard deviation on offense of all teams. Their offense have been very consistent from game to game. The Rockets are joined at the bottom by the Brooklyn Nets, another team fond 3-pointers. From this data, it does not look like 3-pointers increase the variability on offense but one season does not make a significant trend.

18 seasons are however quite reasonable when searching for a trend. In the plot above, 3-point rate is plotted against the standard deviation on offense for each team in the last 18 seasons. There is no obvious relationship between a team shooting a lot of three-pointers and having an offense with high variance in output.
Another way to look at this issue is on a game-by-game level. The plot below shows the three-point rate and offensive rating in each regular season game in the last 18 years.

There is a clear positive relationship between the 3-point rate and offensive output. If more 3-pointers also lead to higher variability, the points in the plot above should spread out more from the trend line as 3-point rate gets higher. That can be quite hard to gauge by eye, so instead I have aggregated the points above in intervals and calculated the standard deviation:

In each end of the spectrum there are too few games for the results to be trustworthy. But even so, a clear relationship between 3-point rate and standard deviation of offense show up in the plot above. I have also run what is called a Breusch-Pagan test, which confirmed that there’s a relationship between the standard deviation of offense and the 3-point rate on a game-to-game basis.
The reason why the relationship does not show up in the second graph can be found on the y-axis of the graph above. Even though there’s a relationship between shooting 3s and having a higher variability, the amount of added variability is very small. The New York Knicks shoot around a quarter of their shots from deep, where as The Houston Rockets shoot a bit over half their shots from 3-point land, but the difference in expected standard deviation for those two values would be 11.3 versus 11.7. Far too little to make a meaningful difference in the course of a 82-game season.
To illustrate how differing 3-point rates affect offensive variance, I have constructed a simulation of four very different teams:

The New York Knicks in the graph above are the team from New York this season. The New York Knickerbockers play in the past and can only take 2-pointers. The New York Rockets shoot half their shots as 2-pointers. And finally the New York Pioneers shoot all of their shots as 3-pointers. The teams have the same free throw percentage, 2-point percentage and 3-point percentage and they shoot the same amount of free throws per game. This is of course an idealized simulation. It illustrates how 3-pointers affect offensive variance, but also shows that we have to go to the very extremes to clearly see an effect. Within an 82-game season, the difference between team’s 3-point rates in today’s NBA makes almost no difference in terms of offensive variance.
Next: Nylon Calculus -- Game Control and a new take on team metrics
In part, also because of trickle-down effects of shooting a lot of threes. Teams that shoot a lot of 3s in general shoot fewer mid-range shots. Long-distance happy teams in general shoot a higher percentage from 2-point range, because their shot-selection improves. This improves their consistency on offense and lowers their variability.
Houston fans need not worry. The offense is very, very good, and there is nothing to suggest that they should be much more susceptible to offensive meltdowns.
