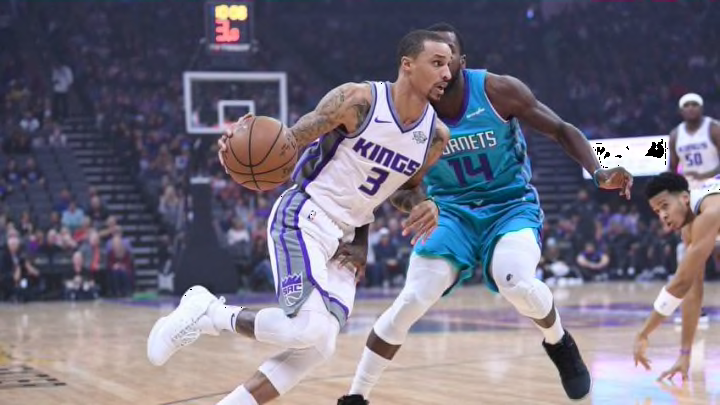
The iconic shot bigs, guards, and children alike practice in driveways and NBA courts is the same. It is Kobe Bryant’s dagger and James Harden’s go to. It’s also the name of this basketball vertical. Today, we’re looking at one of the most unique shots in basketball: the step back.
Defender distance on pull-up jumpers only sways effective field goal percentage about 2 percentage points. The step back is a tool for taking that same pull-up jumper and creating as much open space as possible between the shooter and the defender.
That being said, the space the step back creates is not always consistent. Take this mismatch with Stephen Curry and Jon Leuer. If Leuer simply put a hand up, Steph wouldn’t really have created that much space.
Using effective field goal percentage we can compare the expected values of different shot types. The league average eFG% is 53.4 percent on catch-and-shoot situations while the step back sits at a modest 51.6 percent. For comparison, league average for the pull-up is 43.1 percent. By these measures, the step back is a clear improvement over a vanilla pull-up and which is one of the reasons that step, and the resulting space it creates, is worth seeking.
However, those numbers are for this season. Over the past few years there has been a clear downward trend in the expected value on step back jumpers.

I think we have started to see the law of diminishing returns start to take effect. As the step back is being used more and more frequently, the average value of those shots has declined precipitously.

We have seen a nice bump each year in the number of step backs attempted but the increase in makes hasn’t kept pace. The top 10 players in makes shoot above league average at a clip of 47.8 percent and the rest of the league shoots slightly below average at 43.1 percent.
There are definitely more players taking step backs — 289 players attempted at least one step back jumper during the entire 2012-13 season, compared to the 334 different players last season. This season, 318 players have already attempted a step back with a high likelihood that total surpasses last year’s mark.
Interestingly, the top 10 players in attempts have had always shot at a higher clip than the rest of the field but to varying levels, with 2015-16 being essentially the same. The differential rests at 5.9 percentage points this year, down from the 8 percentage points last year. This suggest that a decline in the average value of step backs is not necessarily that taking more creates poorer looks. It’s likely that the leaguewide increase in attempts is coming from less skilled shooters adding the shot to their arsenal.

Some tea,ms such as the Rockets, have made concerted efforts to emphasize this type of shot selection. The Rockets have shot 251 step backs so far this season with Portland next closest at 215. We see the Suns and Pacers with over 75 shots less than the Rockets. James Harden is the driving cause in Houston, responsible for 66 percent of Houston’s step back attempts.
James Harden is the step back poster child with 18.3 percent of his total shots being of the step back variety, the only player in the league over 10 percent. He shoots it at a league average clip of 44 percent (per NBA Savant), although a league-average mark at such a high volume is significant.
Steph Curry was the first to discover this and found his sweet spot right around 78 attempts. In terms of efficiency, Curry’s worst year matches Harden’s best. Curry is shooting 70.5 percent so far this year on step backs, although that mark is not even the best of his career.
Not everyone will be Steph; it’s clear a collective group of individual players has started to hit the wall of diminishing returns. Dean Oliver’s Offensive Skill Curves appear to be the best way to interpret this phenomenon. There are some player’s like Michael Jordan who can get the ball one time or 100 times in a game and will be equally as efficient but on the whole it defies nature. For most players though, the more attempts they take the more their efficiency declines.
Next: The Encyclopedia of Modern Moves
If the basketball nerds alike want to take this a step further, we can do an analysis looking at variance and distributions by team in the footsteps of Nylon Calculus contributor Bo Madsen.
All data was used from NBAsavant.com unless otherwise specified.
