This post was written in conjunction with Nicholas Canova.
We have reached the end of yet another NBA regular season. With the first-round playoff matchups set and ready to begin on Saturday, let’s take a brief moment to look back on the regular season. In particular, let us see how teams performed relative to their preseason expectations.
Just before the regular season began, Nick gathered the NBA win total predictions that were published from six different sources, and then computed a seventh set of predictions as a weighted average of those six. How did these predictions pan out? Which teams over- and under-performed most, which were hardest to predict, and also which sets of predictions themselves were most accurate? Could betting the over/unders using these predictions have won you some money? Nick gathered the following predictions:

An interesting quick observation: the predicted win totals for all 30 teams from Bovada add up to about 1242, even though there are only 1230 regular season games. I believe that since more fans and bettors choose to bet the overs, online sportsbooks like Bovada and Betonline set the sum of win totals higher than 1230. On average then, it is more likely for 16+ teams to hit the under than for 16+ teams to reach their overs!
Team performance
It is hard to gather much looking at the raw projections, so let us compute some metrics to see how accurate these predictions were.
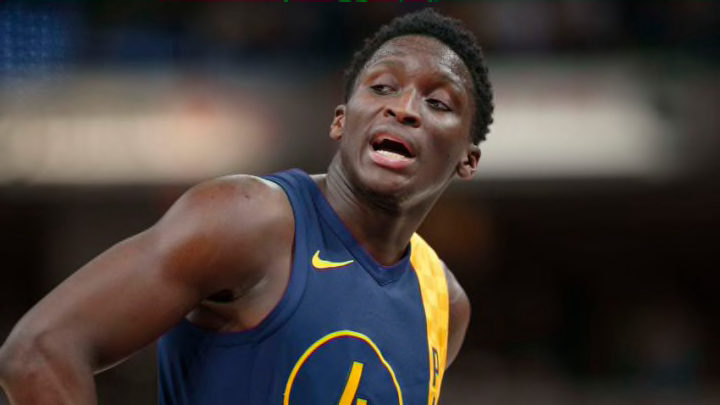
First, the Indiana Pacers (+17.5 games), Philadelphia 76ers (+11.8), Toronto Raptors (+10.6) and Houston Rockets (+9.4) are the four teams that exceeded their average win total prediction by greater than 10 games. Andrew Johnson’s model pinned the Pacers for 36.6 wins, 4.6 wins more than the next largest prediction for the Pacers at 32. Meanwhile, 538 and Bovada were the only two to have Philly at greater than 40 wins.
On the other end of the spectrum, the Memphis Grizzlies (-14.7 games) stood in a class of their own (we collectively thought they would win 37 games…) as a wins underperformer. In the next tier are the Charlotte Hornets (-9.3), Orlando Magic (-9.1), Dallas Mavericks (-8.3), Phoenix Suns (-8.2) and Golden State Warriors (-8.1). 58 wins is enough for the No. 2 seed for the Warriors, but well short of the lofty 66+ wins they were projected to win.
The following graph shows the net wins over predicted wins for each team:

Model performance
Bovada had the lowest mean absolute error, which means on average their win predictions were closest to the actual totals, and Bovada and FiveThirtyEight had the lowest root mean squared errors. Bovada likewise was within one game of predicting the win totals of eight teams this season, a very impressive number.
Next: Presenting the 2017-18 NBA Anti-Awards
If a bettor relied on any of these sets of predictions to bet the over/unders for all 30 teams this season, they probably only won 15-16 bets. Nick’s goal was to win 20 of 30, and that goal will have to wait for another year. Bovada’s relatively good predictions performance probably made it more difficult this year to have won a large number of the over/unders. As well, there were a high number of key injuries this season that likely added additional error over what can traditionally be expected from projections.

That is a wrap. One closing thought, which was mentioned briefly above, is that the win total errors are all fairly similar between the different projection systems. It is interesting to see most models converge at similar solutions despite differing methodology.
Now onto the playoffs.
