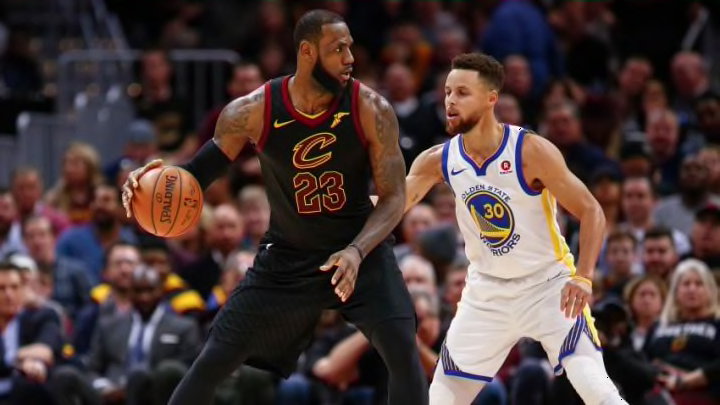
The Golden State Warriors and the Cleveland Cavaliers will meet yet again because this is the era of sequels, and I wish this instance was occuring because the basketball-verse had a compelling reason. But this one, by most objective measures, one of LeBron’s weakest finals teams, winning a mere 50 games with a point differential a hair under one point per game.
Adjusting for the playoff competition, they had a net rating of 5.1 points per 100 possessions, but that’s not factoring in Kyrie Irving’s injury. By contrast, the Warriors had a net rating of 13.9, and even though they benefited from Chris Paul’s injury, they are clearly the favorites. But just how big is that gap?
To illustrate the difference in these teams, let’s get an estimate of how good the Warriors are without their best player, Stephen Curry. I won’t look at raw plus/minus here, which is rife with issues. Instead as a control, let’s look at how they did without Curry but with Kevin Durant to filter out garbage minutes: +2.5 per 100 possessions in the regular season, and +8.9 in the playoffs, per NBAWOWY.com. With Curry and Durant? Those numbers change to +13.4 and +14.8, respectively. You can also use his missed games too: +6.7 with him, including playoffs, and +0.4 without him — and, of course, most of those games are from the regular season.

The Cavaliers, naturally, look a lot worse without LeBron James, but the control was trickier. Few players played the entire season with the superstar, and the one with the most minutes and who had the only other stable starting job in the regular season was the eminently dependable JR Smith (not a great sign), while Kevin Love was used for the post-season. With just Smith, Cleveland was an ugly -9.5 points per 100 possessions, and -10.4 in the playoffs with Love. With James, those skyrocketed to +2 and +11.1, respectively.
We can do more than that too: using Basketball-Reference’s player metric BPM. Cleveland had a -6.5 rating not counting James in the regular season — totaling their player BPM’s without including him — and strangely enough a similar rating of -6.3 in the playoffs. The Warriors? Well, the numbers are +3.0 and a staggering +13.3 for the post-season — remember, Curry missed many playoff games. The Warriors, by some metrics, even without their best player, are still better than the Cavaliers with LeBron James. That’s a tough hill to climb, and you can see why numbers-based projections see the Warriors as the overwhelming favorites.
— Justin Willard (@AcrossTheCourt)
Offensive styles
These charts are not meant to evaluate whether an offense is good or bad. They are designed to help illustrate how teams go about the goal of trying to put the ball in the basket. Each team’s offense is evaluated on four stylistic spectrums.
Ball movement is measured with the average touch time for each team, from the NBA’s player tracking statistics. A lower average touch time means the ball is moving from player to player more quickly.
Player movement is measured with a combination different NBA.com tracking statistics, and works out to average distance traveled per 24 seconds of offensive possession.
Pace is measured with the average length of an offensive possession from Inpredictable, a more accurate representation for how quickly a team is working than traditional pace.
Shot selection is measured with MoreyBall percentage — in this case the percentage of a team’s true shooting opportunities that came at the rim, from the free throw line, or on a 3-pointer. It’s a generalized measure but captures something about how much each team hews to the shots that are, on average, the most efficient.
On the graph below you’ll see a line for each team’s offense. As the line moves away from the center of the graph on each axis you’re seeing more of that stylistic trait. For example, shot selection shows a (hypothetically) more efficient shot selection the further you are from center. Here’s how the Warriors and Cavaliers match up.

The Warriors’ offensive style is notorious for movement of players and the ball. However, in the Western Conference Finals, the Rockets were able to goad the Cavaliers into a slower and more static offensive approach. What’s interesting is that the Rockets and Cavaliers play very similar styles, heavy in isolation and kick-out 3s with a pace that should allow them to grind and avoid turnovers. The Cavaliers plan will obviously be similar to the Rockets, whether they can pull it off is another thing entirely.
— Ian Levy (@HickoryHigh)
Win probabilities
To project the series, I am using my in-season game projection model. The model is trained off historical game data, and accounts for rest, travel, team strength, and matchup. Since I began using the model to predict outcomes, I have been able to correctly identify the winner in about 70 percent of games.

At last we come to the NBA Finals, Warriors-Cavs IV. The Warriors come in as incredibly strong favorites, the model giving them an 89 percent chance to finish with back to back NBA Titles. It’s over twice as likely that the Warriors sweep the Cavaliers than the Cavaliers even win the series (24.6 percent versus 11 percent). The most likely outcome is the Warriors winning in five (30.9 percent), meaning the model suspects the Warriors might lose a game in Cleveland but hold serve the rest of the way. The Cavaliers best shot is to hold serve on homecourt until Game 7 and just hope LeBron can pull off another all-time performance to push them over the edge. The Warriors will win the 2018 NBA Finals without an awful run of luck.
— Jacob Goldstein (@JacobEGoldstein)
