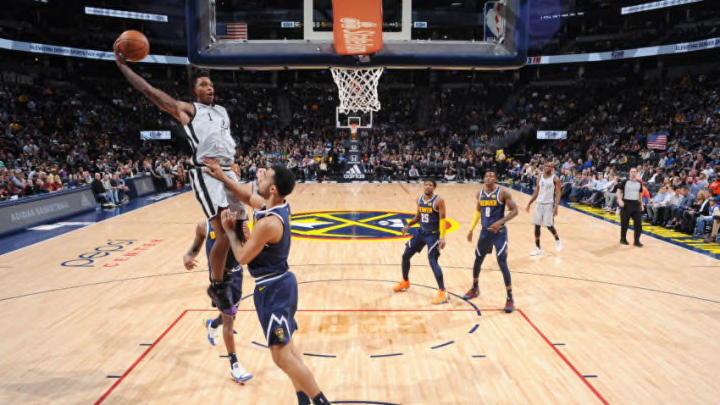
Previewing the first-round series between the Denver Nuggets and San Antonio Spurs with shot charts, assist maps, offensive style charts and expected win probabilities.
Shot charts
The Denver Nuggets’ remarkable season has come on the backs of center-point Nikola Jokic leading them to the seventh-best offense in the league and veteran big man Paul Milsap holding down to the paint for the 10th-best defense. The Nuggets, Bucks, Raptors and Celtics are the only teams in the league in the top ten for both, with the Jazz, Sixers, and Warriors just missing in one category. Around their two interior players is an interchangeable series of guards and wings, from lottery picks to second-rounders. In this group of non-centers is Monte Morris, Malik Beasley, Jamal Murray, Torrey Craig, Juancho Hernangomez, Trey Lyles, Gary Harris, and Will Barton. The chart below breaks out the shooting of these players by position group.

In the latest iteration of Pop being Pop, the Spurs have pivoted away from the pace, space, and 3s style offenses of the modern era, and has instead built this season’s Spurs into the seventh-ranked offense on the backs of a potent mid-range game. The Spurs get 19.2 percent of their points from the midrange, a nearly full four percentage points more than the second-most mid-range heavy team. Further, only 28.6 percent of their overall field goal attempts are from behind the arc, the lowest rate in the league. As a result, they get 57.9 percent of their points from on 2-pointers, the third-most in the league. The below relative density chart shows exactly where the Spurs take their attempts from in comparison to the other Western Conference playoffs teams — heavy in the mid-range, especially the left where LaMarcus Aldridge does his damage.

— Andrew Patton (@anpatt7)
Offensive style chart
These charts are not meant to evaluate whether an offense is good or bad. They are designed to help illustrate how teams go about the goal of trying to put the ball in the basket. Each team’s offense is evaluated on four stylistic spectrums.
Ball movement is measured with the average touch time for each team, from the NBA’s player tracking statistics. A lower average touch time means the ball is moving from player to player more quickly.
Player movement is measured with a combination of different NBA.com tracking statistics and works out to average distance traveled per 24 seconds of offensive possession.
Pace is measured with the average length of an offensive possession from Inpredictable, a more accurate representation for how quickly a team is working than traditional pace.
Shot selection is measured with MoreyBall percentage — in this case the percentage of a team’s true shooting opportunities that came at the rim, from the free throw line, or on a 3-pointer. It’s a generalized measure but captures something about how much each team hews to the shots that are, on average, the most efficient.

These two offenses represent a sharp contrast and it will be interesting to see the relatively deliberate Spurs’ offense next to the whirling movement of the Denver Nuggets. Incredibly, their season-long offensive efficiencies were almost identical.
— Ian Levy (@HickoryHigh)
Assist maps: DeMar DeRozan
After years as a secondary creator in Toronto, DeMar DeRozan has been obliged to take more responsibility as a ball-handler in San Antonio, this season. He’s leading the Spurs in assists (6.2, a career high) and time of possession (5.1 minutes) per game and he’s doing a nice job of creating offense for his teammates.

With the ball in his hands, DeRozan is constantly on the attack, probing for weaknesses in the opposing defense. He averages 18.6 drives per game, which ranks second-most in the league behind only James Harden. In DeRozan’s passing charts we can see his knack for getting to the area below the foul line where he can elevate and distribute assists all around the perimeter. Several of DeRozan’s niftiest passes came after drives that brought him all the way to — or even under — the basket.
Another observation from DeRozan’s passing-lane charts is the relative lack of long assists towards the basket. The Spurs score the third-least fast break points of any team (just 10.4 per game) so it makes sense that DeRozan has logged just a few outlet passes from the backcourt.
In the four games that the Spurs split with the Nuggets this season, DeRozan was most often guarded by Torrey Craig and Will Barton. During these possessions, the Nuggets kept the Spurs below their average offensive rating and we will see if this pair can keep DeRozan out of the lane again during the playoffs.
— Todd Whitehead (@CrumpledJumper)
Win probabilities
To project the series, I am using my in-season game projection model. The model is trained off historical game data and accounts for rest, travel, team strength, and matchup. Since I began using the model to predict outcomes, I have been able to correctly identify the winner in about 70 percent of games.

The Nuggets come into the series as strong favorites, winning in 78 percent of the 10,000 simulations. The average length of the series was 5.3 games, with the Nuggets given over a 15 percent chance to sweep the series. Despite a rocky close to the season, the Nuggets finish with the No. 2 seed and are in a good position to make it out of the first round. The Spurs will need to finally get some traction in road games if they hope to pull off the upset. Pop could make this a close one, but expect the Nuggets to finish off the Spurs and get back on track to who they were earlier in the season.
— Jacob Goldstein (@JacobEGoldstein)
