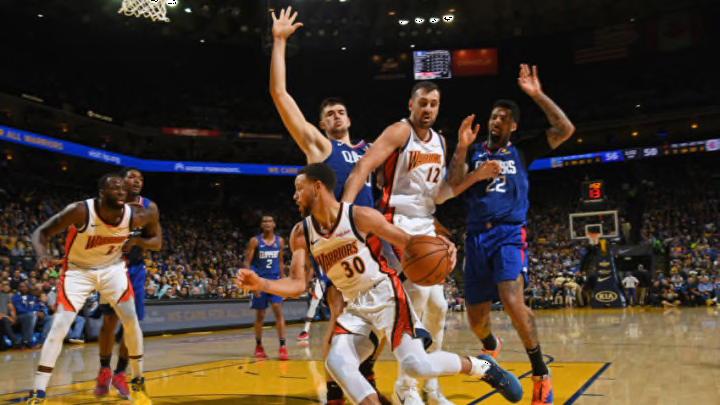
Previewing the first-round series between the Golden State Warriors and Los Angeles Clippers with shot charts, assist maps, offensive style charts and expected win probabilities.
Shot charts
In a tremendous underdog story, the Golden State Warriors once again finished with the number one seed in the Western Conference playoffs. As always, they were led by the original trio of Stephen Curry, Klay Thompson and Draymond Green plus Kevin Durant. The Warriors are most known for their 3-point shooting and in fact, are third in the NBA in percentage at 38.4 percent. However, they only are seventh in terms of 3s attempted per game at 34.6. Notably, due to the incredibly shooting skill of Curry and Durant, the Warriors are also second in the league in percent of points from the mid-range at 15.6 percent. As a team, the Warriors are league leaders at 46.5 percent from 10-14 feet and 49.2 percent from 15-19 feet and third from 20-24 feet at 41.8 percent. The chart below breaks out each of the primary four Warriors in terms of approximate area field goal percentage.

In what is sure to go down as one of Doc Rivers’ best coaching jobs, the relatively star-less Clippers comfortably made the playoffs. The Clippers have had 22 players get time on the court throughout the season. After mostly remaking their roster with the Tobias Harris/Philadelphia trade, the Clippers continued to roll, led by one of the strangest rotations in the league, with bench and starters essentially equal or flipped in terms of player quality. Specifically, Lou Williams and Montrezl Harrell have combined for six starts, but each average greater than 26 minutes per game, and have played in 75+ games each. They both are highly productive offensively (Lou for both teams with a -2.6 DBPM), with OBPMs of 3.2 and 2.5 respectively. The chart below shows the relative density of field goal attempts and the approximate area field goal percentage for these two super subs. Given that Harrell has attempted only 17 3-pointers all year, try not to take his shooting numbers behind the arc too seriously.

— Andrew Patton (@anpatt7)
Offensive style chart
These charts are not meant to evaluate whether an offense is good or bad. They are designed to help illustrate how teams go about the goal of trying to put the ball in the basket. Each team’s offense is evaluated on four stylistic spectrums.
Ball movement is measured with the average touch time for each team, from the NBA’s player tracking statistics. A lower average touch time means the ball is moving from player to player more quickly.
Player movement is measured with a combination of different NBA.com tracking statistics and works out to average distance traveled per 24 seconds of offensive possession.
Pace is measured with the average length of an offensive possession from Inpredictable, a more accurate representation for how quickly a team is working than traditional pace.
Shot selection is measured with MoreyBall percentage — in this case the percentage of a team’s true shooting opportunities that came at the rim, from the free throw line, or on a 3-pointer. It’s a generalized measure but captures something about how much each team hews to the shots that are, on average, the most efficient.

The Warriors offensive style has veered away from their use of the 3-point shot, with the isolation tendencies of Kevin Durant keeping their efficiency just as high but generating lots more shots in the mid-range. The Clippers actually play a similar style — a little less movement but comfortable leveraging space inside the arc.
— Ian Levy (@HickoryHigh)
Assist maps: Lou Williams
I know you’re still scrolling down to the part of the preview where Jacob predicts the outcome of this series, but — SPOILER ALERT — the Clippers are not expected to win. Before we dismiss LA completely though, let’s take a minute to celebrate the presumptive Sixth Man of the Year, Lou Williams. Despite being in the starting lineup for only one contest this season and playing just 27 minutes a night, Williams is leading the Clips in assists (5.4) and time of possession (4.5) per game — he’s the team’s most important creator.

Williams is an AGGRESSIVE creator, too. Among the top 50 most-frequent ball handlers in the league (i.e., the guys who hold the ball in their hands for 4.2 minutes per game or more), Williams has the 9th-highest drive rate (2.7 drives per minute of possession). Only 31 percent of Williams’ drives lead to a pass, but when he does give the ball up, Williams is usually dropping it off to Montrezl Harrell for a dunk. Williams assisted 178 of Harrell’s baskets this season. Indeed, among the top 50 ball handlers, nobody had a larger fraction of their assists converted at the rim than Williams did (60 percent).
— Todd Whitehead (@CrumpledJumper)
Win probabilities
To project the series, I am using my in-season game projection model. The model is trained off historical game data and accounts for rest, travel, team strength, and matchup. Since I began using the model to predict outcomes, I have been able to correctly identify the winner in about 70 percent of games.

The Warriors come into the series as very heavy favorites, winning in 94 percent of the 10,000 simulations. The average length of the series was 5.1 games, with the Warriors given over a 32 percent chance to sweep the series. Doc Rivers has done a fantastic job this season rallying his team into the playoffs, a very impressive team-first organization. The Warriors come into the playoffs with the highest projected playoff strength at +12.4 points per 100 possessions. This series will be done in four or five games, with the Clippers needly to win the first three games in a row to even become projected favorites. The Warriors are rolling and it will take a herculean effort from the Clippers and a good amount of luck to pull off an upset.
— Jacob Goldstein (@JacobEGoldstein)
