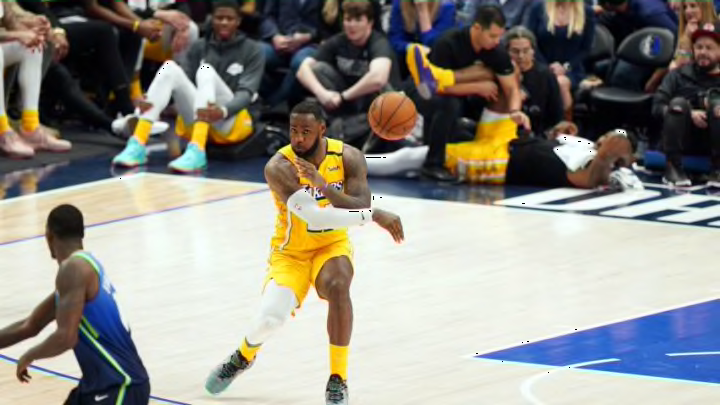
New data on NBA player passing tendencies can help us visualize the structure of an offense in a new way.
Last season I experimented with charting players’ passing tendencies by tracing the path of their assists from the origin of the pass to the point where the scorer caught the ball. But, because I was hand-tracking all of the plays, it was a pretty tedious process and I was only able to look at about a dozen different star players and to track maybe 1,000 assists overall. Aside from its limited scope, another big drawback of my initial approach was that I logged exclusively assists and ignored all the other passes.
Recently Darryl Blackport (@bballport) – the wizard behind all of the magic at PBPstats.com – has started his own hand tracking project. So far, he’s logged the coordinates of over 4,000 passes that led to a 3-point shot, including all of the catch-and-shoot 3s attempted by the Raptors and the Lakers this season. Blackport enhanced this neat resource by linking each pass to additional play-by-play data, such as the action that started the possession, the amount of time on the shot clock, and whether the shot was wide open.
In an effort to put this new treasure trove of hand-tracked data to good use, I took inspiration from the pass sonar charts created by soccer analyst, Benoit Pimpaud (@Ben8t). His pass sonars consist of a series of radial bar charts, with one chart centered at each player’s location (based on their initial formation on the field) showing how often each player likes to pass the ball in every direction. Because a basketball player’s physical position on the court tends to be very fluid, it has been challenging to create an analogous visual for the NBA. However, by narrowing our focus to include only those passes which resulted in catch-and-shoot 3-point attempts, we can make something similar for the other beautiful game.
My version of the pass sonar chart includes six passing locations: from the paint, from the top of the key (inside the 3-point line), from outside the 3-point line on the left, from outside the 3-point line on the right, from between the paint and arc on the left (under the FT line), and from between the paint and the arc on the right. For each passing location there is a set of four bars which indicate how often the player passed to each of four 3-point shot zones: to the left and right corners and to the left and right sides above the break.
Aside from showing the frequency of passes to and from each combination of court locations, there is a second layer of information to be found on these charts. The color of the bars at each passing location indicates what fraction of the resulting catch-and-shoot 3-pointers were wide open. Bright red bars mean that many (40 percent) of the 3-point attempts created from that spot were wide open, whereas white bars mean that none of those attempts were wide open. This gives us a sense of the quality of shots that the player is able to create with his passes.
Using the database of available passes from PBPstats, I picked out the four most prolific passers – LeBron James and Rajon Rondo from the Lakers plus Fred VanVleet and Kyle Lowry from the Raptors – and worked up a passing-lane chart for each player.

All four of these players are nominally point guards, but the charts help to show that they are distributing the ball in very different ways. Let’s start by comparing the passing tendencies of the two Laker ball handlers.
James is able to penetrate inside and kick the ball outside for wide-open 3-pointers. About a third (31 percent) of the catch-and-shoot 3-pointers he has created were initiated with a pass from the paint and 22 percent of those shots were wide open. This type of inside-out pass was James’ most effective path to creating a wide-open 3-pointer for his team.
In contrast, Rondo is much less likely than James to set up a 3-pointer for a teammate by driving inside first. Most of the catch-and-shoot 3-pointers that he has created (68 percent) started with a pass from behind the arc or from the top of the key. Only 14 percent of these perimeter passes (swing passes, skip passes, shovel passes, etc.) led to a wide-open 3-pointer.
We notice a similar contrast between the Raptors’ primary ball handlers. Like Rondo, Lowry initiates a lot of his teammates’ 3-point attempts with passes from outside the arc (although he has passed to the corners more often than Rondo). VanVleet, in contrast, is distributing the ball a lot like James. Of the 227 catch-and-shoot 3-pointers that VanVleet has initiated, he passed 85 (37 percent) of them from the paint.
In addition to the pass sonar, there has been other evidence of VanVleet’s elite, LeBron-like ball distribution this year. James, of course, has had the ball in his hands more than almost any other player in the league – posting an individual time of possession of 7.6 minutes per game; but VanVleet is really not that far behind him, with 6.3 minutes of ball possession each night (15th-most in the NBA). Moreover, VanVleet is attacking off the dribble – racking up 16.3 drives per game; more, even, than James (13.7). It’s surprising but true!
These new passing charts could reveal surprises like this for other players too. And the information these charts provide could help teams game plan for individual opponents, allowing them to prepare defensive strategies designed to obstruct a passer’s most effective passing lanes and thereby limit their opponents’ opportunities to create wide-open 3-point attempts.
