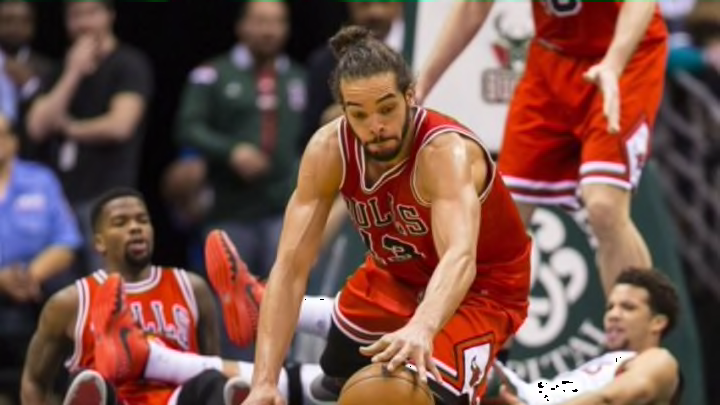
Intangibles. Winning plays. Good floor game. Contributions that don’t show up in the box score.
Whatever the term used, nearly everyone recognizes that even in this age of SportVU cameras and detailed game charting a lot happens in a game that simply can’t be quantified. [1. A large part of the appeal of one-number metrics based on floor time and plus-minus is to the extent these actions genuinely impact the outcome of a possession or game, the effects can be measured.] If Matthew Dellavedova diving on the floor and/or opponents’ ankles makes an appreciable difference, that difference would should up in his adjusted on/off data in a way not explained by his more traditional stats. Or so the conventional wisdom goes.
The NBA is putting that theory to the test during the Las Vegas Summer League. By tracking what they have termed “hustle stats” the league is attempting to make those intangibles a little less so. For every game here, a team of two charters is tallying up all the times players contest shots with their hands up, draw charges, deflect passes and recover loose balls. Those stats are then combined into a hustle score. These charters are in addition to and separate the regular score and stat-keeping crew.
Accounting for these kinds of things is not a new idea. College coaches have famously been charting deflections for years, as have NBA teams, though often with less fanfare. “We know that teams are already tracking various ‘hustle’ statistics themselves, usually with an assistant coach tracking this data live from the bench.” said Kiki Vandeweghe, NBA Senior Vice President, Basketball Operations, via email. “Usually [it is] an assistant coach tracking this data live from the bench.”
This tracking requires intense focus; if the coach’s attention wanes for a moment, he or she might miss a deflection or not be able to tell if a closing defender had his hand up in time to effectively contest a shot. Thus the assistant is basically reduced to the role of an adjunct scorekeeper for the game. Further, each team only had the information for their own team. What has happened in 1148 regular season games remains opaque, and without the baseline of a league average, evaluating performance based on hustle-type steps is extremely difficult[3. A problem replicated every time I look at one of the tracking sheets, notice Milwaukee rookie Rashad Vaughn had a hustle score of 1.4 for his first game here and wonder to myself “is that good?”].
The league’s nascent analytics department thought it might have a solution to these issues of completeness and focus. “We thought teams would be interested in a uniformly defined and collected version of this data, ensuring data quality and consistency.” said Vandeweghe.
It’s all very much a work in progress. The process itself is the NBA’s version of Schoolhouse Rock. Instead of bill becoming a law, this is the first step in a statistical idea becoming a quantified metric. From as a suggestion or “what if” months ago, the act of quantifying “hustle” has been planned, costed, beta tested, tweaked and is now getting its first real trial by fire this week. It hasn’t gone off without a hitch, because nothing ever does. Tracking down a copy of the hustle stat sheet from any given game has been a challenge, especially early in the first weekend’s games. The league itself hasn’t released a collected or collated version of the stats across multiple games, instead relying on daily highlights.
The stats being tracked don’t and are not intended to represent an all-inclusive accounting of every possible hustle play. No player is getting a “floor burn” score, nor are “hustly” things such as tipped rebounds or out-of-bounds saves being collated. The five stats selected might almost be termed “the defensive little things.” Which isn’t a terrible working definition of hustle when you think about it.
For this reason, the league has been somewhat guarded about widespread dissemination of the data. The accuracy and scalability of the tracking process are of far more concern here than using anything learned as an analytic or evaluative tool. There have been daily highlights bulletins, but no indication the collated data will be released. Still even on this small sample, some intriguing observations can be made. Through Monday’s games, for example, winning teams have averaged 1.5 more deflections per game than losers. Whether this has statistical or practical significance it is too early to tell, but that sort of confirmation of an assumption born of long observation and experience at all levels of the game doesn’t hurt.

The charting itself seems to be going smoothly, the two-person teams working well, especially after a few games are under their belts. As importantly, the level of interest in these new stats on press row[4. No, I still can’t get you the totals from games X, Y and Z guys…] has been consistently high. Fan interest has been piqued as well, with this article speculating on which players’ reputations will benefit most from tracked hustle data having over 50 thousand reads.
Still, we probably should not expect to see these metrics used in the full NBA quite yet though. According to Vandeweghe “this is a pilot program. We want to analyze the data we collected, solicit feedback from teams, reflect on the entire process, and then determine what should follow.”
