
We know the shot clock acts as another defender—shots early in the shot clock are almost always more efficient than shots late in the shot clock. What we don’t know is who is taking those shots, which presents an interesting dilemma: is the higher efficiency earlier in the shot clock due to the effects of the shot clock, or is it just because guys like Kyle Korver are taking shots earlier in the shot clock while guys like Rajon Rondo end up taking shots towards the end of the shot clock? Those are extreme examples, but the point is that we need to account for who is taking shots to really see the nature of the shot clock effect.
SportVU tracks six different shot clock categories[1. Those are: 24-22 seconds, Very Early (22-18), Early (18-15), Average (15-7), Late (7-4), Very Late (4-0).] and we can match each shot in each category with the player’s overall shooting percentages from different locations[2. Those locations will be three-pointers, midrange shots (defined as anything from five feet out to the three-point line) and shots in the restricted area]. For example, let’s say there were five midrange shots taken in the Very Late category[3. Obviously there are going to be way way way more.] and those shooters were Harden 2x, Curry 2x and Lebron once. Harden is a 43.6% shooter from midrange, Lebron is a 47.6% shooter from midrange while Curry is a 47.8% shooter from midrange[4. These averages are found over the last 2 years and come from the same dataset — the SportVU shot logs. Likewise, all attempts are taken over the last 2 years.]. We find the weighted average of these five shooters[5. So in this example, it’d be: (43.6% + 43.6% + 47.6% + 47.8% + 47.8%) / 5] and that is our overall average for the Very Late category. And then we compare this with the other categories to see the differences. We are essentially determining the “goodness of shooters” by using their overall average, which is presumably a proxy for their true ability at each shot location. [6.A better way may be to use career numbers but then we aren’t accounting for the fact that players can improve as shooters. It’s a slippery slope either way and certainly not perfect but I think it works.]
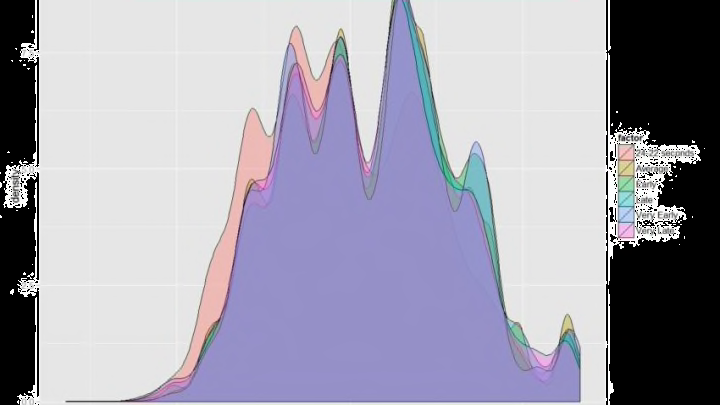
So are there any differences in who is shooting early versus late? Let’s look at this graphically:

There does appear to be a gradual decline in 3PT% with better three-point shooters taking shots earlier, but the difference isn’t massive. Still, this could be part of the reason that three-point shots see a larger decline in efficiency across the shot clock compared to both midrange shots and shots near the basket—where we don’t really see any difference in the types of shooters across the shot clock.
There is a decline in the types of shooters for shots in the 24-22 second bin compared to the other bins for shots in the Restricted Area. This indicates that players who are better shooters around the basket are taking more shots in that 24-22 second interval compared to other shot clock intervals. This is almost certainly the result of offensive rebounds. Bigs are invariably more likely to get offensive rebounds and bigs are also invariably more likely to be higher percentage shooters around the rim. An offensive rebound resets the shot clock meaning most put-backs would occur within that time interval.
However, outside of the slight decline in 3PT% and the difference in the Restricted Area 24-22 second bin, the average FG%’s of the types of shooters remains relatively constant across each shot clock bin. We can test this by performing t-tests to see if any of these differences in the mean FG%’s are in fact statistically significant.

As I mentioned in a previous article, with large sample sizes, everything can be statistically significant. So I’ve employed the same technique to test for “practical significance[7. The nitty gritty details: I sampled data from each group, (1000 observations), and compared the difference in means of the samples by running the t-test again. I did this 1,000 times. The practical significance number is the % of times the sampled t-tests were statistically significant.]” These results tend to be more telling, though still not perfect. So, for example, we can essentially say that in ~ 90% of the samples between Very Early three-point shots and Early three-point shots, there was enough evidence to suggest the means were different. The practical significance numbers tell a similar story to what we saw graphically earlier: there are differences in the means for 3PT%, but for the other shot locations, it’s relatively the same, minus the Restricted Area 24-22 second bin. We do see that it’s essentially a toss-up as to whether the means for Very Early midrange shots and Early midrange shots and also Late RA shots and Very Late RA shots are significantly different but given what we saw graphically earlier, I’m inclined to believe these differences aren’t significant.
Of course, it’s not just the average FG% for these locations that can give us some insight, the variance can as well.


The variance is fairly similar across the shot clock except for Very Late three-point shots and 24-22 second shots in the Restricted Area. The latter having a smaller variance makes sense in that these players are going to be mostly offensive rebounders and will probably have more similarities in their shooting percentages. The former having a higher variance also makes some sense in that all types of players are going to have the ball towards the end of the shot clock. If we ever see a guy like Tim Duncan shooting a three-pointer, it will usually happens at the end of the shot clock.
Having looked at the quality of shooters taking shots at different points in the shot clock, the natural extension is looking at players by usage. Are higher Usage players taking shots towards the end of the shot clock? Is the distribution roughly the same?[8. I’m using just 2013-14 data here because it’s a full seasons’ worth of data and because I haven’t gotten a chance to merge the 2014-15 Usage data with the SportVU shot logs.] Let’s look at this graphically again:

The averages look to be roughly equal in all of the different shot clock bins. Are any of the differences statistically significant? Let’s use the technique employed earlier to see:

So in all of the samples of 24-22 seconds and Very Early shots, there was enough evidence to suggest that the means were different. And we saw this visually in the graph above where the mean Usage rate was lower in the 24-22 second bin compared to the other bins. Why is this the case? Again, I’d hypothesize it’s due to players who get offensive rebounds. The players getting offensive rebounds in the 24-22 second bin may be lower usage players on average. These shots are also likely direct putbacks as opposed to long rebounds[9. Direct putbacks are generally occurring right after a missed shot while a long offensive rebound might result in more time going off the shot clock], hence we’re likely talking about Bigs getting a majority of these rebounds.
We can also see this trend visually without binning the data[10. And here’s what the trend looks like accounting for home-road splits. And here’s the trend line for every team from last year]:

As we saw before, slightly lower Usage players are taking shots at the very beginning of the shot clock but then it evens out and remains relatively constant throughout the shot clock. How about the distribution and variance of Usage across the shot clock?


The variance is mostly the same which means that the spread of players taking the shots in each shot clock bin is roughly the same. So what does all of this mean?
Let’s start out with usage. The fact that the average Usage Rate of the shooters is staying relatively constant throughout the shot clock indicates that stars aren’t really any more likely to shoot earlier or later[11. Of course “stars” is a relatively broad term that could mean all sorts of things.], the same for role players. The fact that the overall midrange FG% and overall Restricted Area FG% of the shooters also stays relatively constant throughout the shot clock could further implies that which types of players shooting more frequently at different times during the shot clock isn’t really a factor in the declining efficiency of shots throughout the shot clock.
We do see a slight decline in overall 3PT% of the shooters and keep in mind that usage is staying relatively constant[12. It’s probably worth looking into the interaction between Usage of the shooters and overall 3PT FG% of the shooters.]. This could indicate that high-usage stars who aren’t as good three-point shooters (say Russell Westbrook) are more likely to take later three-point shots than high-usage stars who are better three-point shooters (maybe Steph Curry)[13. I’m not actually saying Westbrook shoots more three-point shots later in the shot clock than Steph Curry. It’s all relative to the other intervals of the shot clock and Westbrook’s rate of late three-pointers could be comparatively higher. Was that confusing? Yup.]. Or likewise, low-usage players who are better three-point shooters (an Anthony Morrow type) are just as likely to shoot a three-pointer late in the shot clock as a low-usage player who isn’t a good three-point shooter (Andre Roberson).
What this all means is that the who does matter for three-point shots. The nosedive I’ve found in 3PT% across the shot clock compared to other locations could be somewhat explained by who’s taking the shot. But the other locations? The evidence isn’t really there to explain why a contested off-the-dribble shot near the basket at six seconds might be less efficient than that same shot at 15 seconds. The effectiveness and usage of the shooter is just as likely to be the same at six seconds compared to 15 seconds given the means and variances we saw earlier.
All this is to say that the defensive advantage gained by forcing offenses to work later into the shot clock is about more than forcing the ball into the hands of specific players.